ETL of JSON Data to Neo4j Graph DB

Introduction
One of the main advantages of a graph database over a traditional relational database is flexibility. This flexibility can save time and effort when subject to a changing data schema, unforeseen querying requirements, or there exists a general priority on relationships versus the object’s properties. Despite this inherent flexibility, ingesting various types of data into a graph database still requires an organized approach to yield a graph that is balanced between the needs of reads and writes and has some optimization.
We will utilize KNIME (v 4.6.1) as the ETL tool to have control over what the data looks like and how it is loaded into the graph. Ultimately, the goals are twofold: to craft a Neo4j-friendly data model out of sample JSON data and to build a KNIME ETL workflow to move the data into the graph.
Project Problem
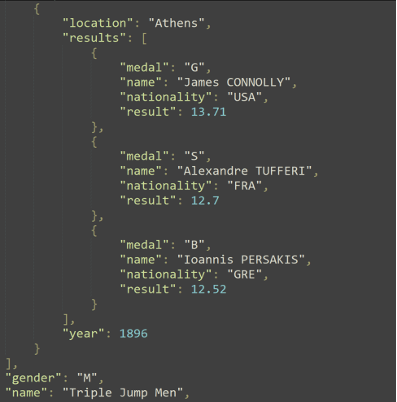
Image 1
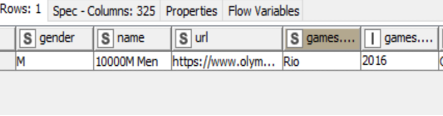
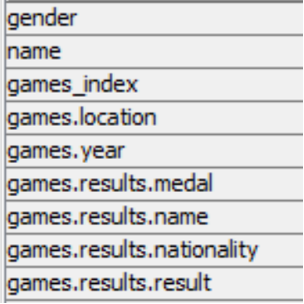
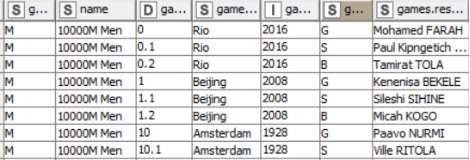
The problem addressed today involves loading a modest sized JSON into a Neo4j graph database. We want to adjust the names of some objects and their properties, utilize certain properties as labels to take advantage of Neo4j’s speedy indexing, and ultimately provide a flexible graph representation of the data that is ready for querying.
The data in question (see Image 1) is the list of all individual Olympic Track and Field medalists since 1896. This includes 47 different events in total across 29 Olympic games. Recent games featured all 47 events, while the 1896 games only had a dozen events. Ties in track and field often result in shared medals and this data features up to six medalists for a single event.
To summarize the data and what we will have to handle:
- Discontinuous results with unknown number of medalists for up to 47 events over 29 games
- No unique identifier provided for athletes (name only).
- Four cities have hosted the summer Olympics 2-3 times each, resulting in events of multiple years associated with a singular location.
- Many athletes received medals for multiple events in one or more Olympic games.
- The JSON contains one list of objects with each being a single named event (e.g.: 100M Dash Men) and contained within is the set of all medal information for that event.
Project Approach
There are many ways to load this type of data in Neo4j. The best way would normally answer the following questions:
- What will this data be used for?
- What queries should it handle well?
- What other data sources may be added?
Absent a real business need, we will list a few priority query requirements so we can set a desired schema. Example use cases for this data are:
- Performing data analysis on the medal results (times, distances, heights, etc.) over time.
- Create a medal count table by country for any time period of the data set.
- Find athletes who medaled in the same event multiple games in a row.
- Query a result given an event name, year, and medal type.
Given these use cases and information about the data we can make some conclusions about the data model:
- The year of the games is a better descriptor than the location (due to duplicates).
- The athlete (by name) is not a good fit for a direct query, since the data set made no effort to deconflict different athletes of the same name or those that changed names over time.
- Querying by country should enable the return all associated athletes, regardless of event or year.
- The graph will need to have succession built in because the events are not continually represented every year since the beginning.
- The combination of event information (year, event name, gender) makes for a solid anchor node that is unique throughout the graph (i.e.: only one 100M Dash-Male in 1992).
- Instead of athlete-based nodes, each event as described above will have 1-n “medalists” nodes, labeled with the medal type and athlete name as a property (these will not be unique).
- Each medalist node will have a connection to that athlete’s country.
This results in a rough data model (see Image 2) to guide the creation of an ETL workflow. Combining the event name and venue/year information into a single node allows for a unique anchor on an event if the year, event, and gender are known. “Medalist” nodes display the results of the event and possess a link to the athlete’s country. This should be sufficient to answer the above questions.
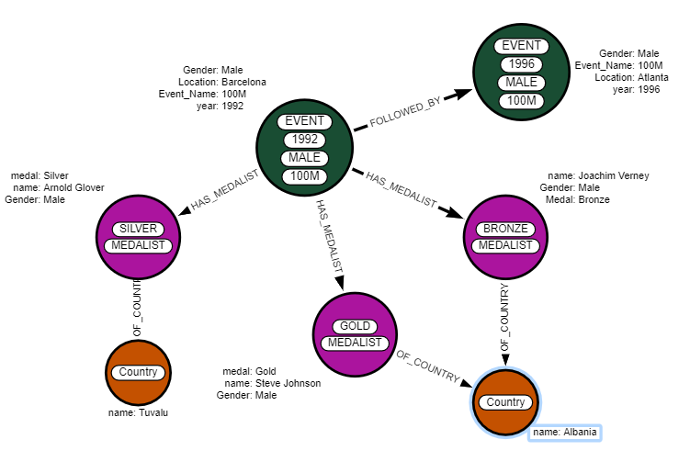
Image 2
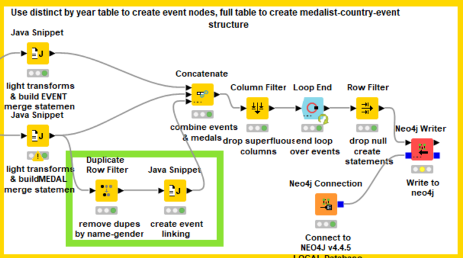
Building the Workflow
The general goal of this ETL workflow is to create a node for each event, link each medalist to the event, and link the medalists to their country. The ETL solution requires some “pivoting” around a weakness in the JSON structure – namely that we will have no idea how many occurrences of a particular object (in this case, a Track and Field event) are present within one event’s object list. The 100M dash could have 25 objects, while the Triple Jump may have twelve. We will accomplish this in five steps:
- Convert each event’s JSON to table form
- Unpivot each event to standardize column name, then repivot into YEAR-EVENT rows
- Unpivot each YEAR-EVENT row by medal type, repivot into YEAR-EVENT-MEDAL rows
- Sanitize, fix data types, transform values as needed
- Split data into two groups for two types of neo4j create statements:
- Create event node
- Create medalist-country relation, then link medalist to event
The above five steps are further explained below in five tables containing an image of that section of the workflow, node configuration settings and images of the data.
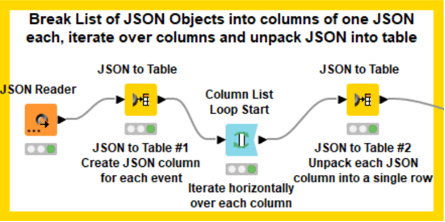
Workflow Step 1
#1 Convert each event’s JSON to table form
Step Image
Data After First Node
Configuration
JSON Reader: Default
JSON to Table #1
- Remove Source Column
- Output column names: Path with separator ( . )
- Arrays: Expand to columns
- Children Expansion: Only up to level 1
Column Loop: Default
JSON to Table #1
- Remove Source Column
- Output column names: Path with separator ( . )
- Arrays: Expand to columns
- Children Expansion: Only leaves
Data After Last Node
Comments
The initial JSON to Table action yields a separate column for each of our 47 events. Looping horizontally over each of these event columns allows for the handling differently sized JSON object individually.
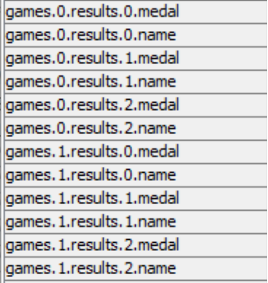
The second JSON to Table action produces a single row containing un-JSONed values with column names that reflect object identifiers due to the output column name with dot notation congiuration (paths with separator). An example of just name and medal columns are shown at right.
At this point the data table’s column headers seem confusin and may require explanation. “Games.0” represents a single year of games (1992, for example). “results.0” represents a single medal instance of those games. Therefore “games.0. results.0.medal” might be gold, and “games.0.results.1.medal” might be silver, with the “name” column to label the corresponding athlete.
There are several ways to progress from this point. KNIME will not allow changing column names used in static java implementations and therefore requires an action to standardize column names.
Workflow Step 2
#1 Convert each event’s JSON to table form
Step Image

Data After First Node

Configuration
Unpivoting:
- Value Columns – include all dot notation columns
- Retained Columns – exclude all dot notation columns
- Possible with regex: (\D+\.\d{1,2}\..*) toggle exclude for Retained
Java Snippet
- Unpivot node creates “Column Names” column
- Split these values on the period
- Use the array value at index [1] as the numeral in the new games_index column (see code note #1)
Pivoting
- Group: Ignore RowIDs, ColumnNames and Column Values, keep others (name, gender, games_index)
- Pivots: ColumnNames is our Pivot
- ManualAggregation: ColumnValues, First, Keep original names
Data After Last Node
Comments
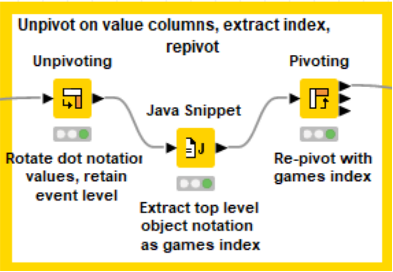
This is the first of two similar actions: unpivot, extract object index, repivot. It accomplished an unpacking of a 1:Many relationship into multiplie rows (instead of dot notationed columns). The java snippet’s code is flexibile enough to handle JSON of varying depth, as well as multiple top level objects by name, although some care is required to keep them separate in the next step.
At this point of the workflow, we have unpacked the shorter of the two dot notation column names (e.g.: games.0.year) into YEAR-EVENT rows. The next step will handle the longer version (games.0.results.0.medal). This process could be repeated as many times as needed, or add another Column List Loop – JSON to Table combo to reduce the number of unpivot-pivot steps.
Workflow Step 3
##3 Unpivot each YEAR-EVENT row by medal type, repivot into YEAR-EVENT-MEDAL rows
Step Image
Data After First Node

Configuration
Unpivoting:
- Value Columns – include all remaining dot notation columns with numerals
- Retained Columns – exclude all remaining dot notation columns with numerals
- Possible with regex: (\D+\.\d{1,2}\.\D+) toggle exclude for Retained
Java Snippet
- Unpivot node creates “Column Names” column
- Split these values on the period
- Use the array value at index [1] as the numeral in the new games_index column (see code note #2)
Pivoting
- Group: Ignore RowIDs, ColumnNames and Column Values, keep others (name, gender, games_index, games.location, games.year)
- Pivots: ColumnNames is our Pivot
- ManualAggregation: ColumnValues, First, Keep original names
Data After Last Node
Comments
The second unpivot – repivot step unpacks the final 1:Many relationship into multiplie rows (standardizing the last of the dot notationed columns). What remains is the entire historical record of a singular olympic event where each row is has a unique games_index value and contains one value for each of YEAR-EVENT-MEDAL. The fact that there are multiple medals of the same type for certain events is of no concern, and this data is ready for a final sanatize / transform process.
Workflow Step 4
##3 Unpivot each YEAR-EVENT row by medal type, repivot into YEAR-EVENT-MEDAL rows
Step Image
Data After First Node
Configuration
Auto Type Cast:
- Excluded the results column
Java Snippet
- Stringified the results column ignored above
Duplicate Row Filter
- Removed duplicates on year column
Column Filter
- Kept event-related columns (year, location, gender, event name)
Data After Last Node
Comments
The penultimate effort – a small amount of data cleanup and the full set of records moves to the next step. A unique list of all values in the year column are pulled aside to facilitate event creation in the next step.
Workflow Step 5
#5 Split data into two groups for two types of neo4j create statements
Step Image
Data After First Node
Configuration
Java Snippet (TOP)
- Build event merge statements (see code snippet #3)
Java Snippet (BOTTOM)
- Build medalist merge statements (see code snippet #4)
Duplicate Filter (Green Box)
- Dedupe on Name-Gender
Java Snippet (Green Box)
- Create cypher command to link events by type in year order (see code snippet #5)
Concatenate
- Event on top, medalist in middle, apoc linking on bottom
Column Filter
- Keep create statement column
Loop End: Default
Row Filter: Drop missing rows
Neo4j Writer
- Query from table, create statement column, stop on failure
Data After Last Node
Comments
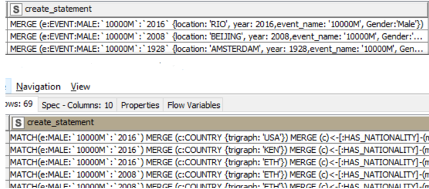
The last step begins with the creation of two types of neo4j merge statements. First, our de-duplicated list of years-events-locations-gender allows a fairly simple conversion into a single merge statement. The lower java node has a bit of extra code to handle medal ranks as numbers and a lengthier create statement featuring a match and three merges. Additionally, linking together events of the same event name & gender labels has a certain utility for this effort, so a third java snippet creates a special linking statement. These three tables produce columns of the same name which concatenate together. After dropping excess columns the loop iterates to the next event type. Finally, a row filter drops any null statements and loads the data into neo4j.
Project Summary
With data successfully loaded into neo4j, the final task is to examine how our current graph DB addresses the needs as outlined in the project approach.
- Performing data analysis on the medal results (times, distances, heights, etc.) over time
- Create a medal count table by country for any time period of the data set
- Find athletes who medaled in the same event multiple games in a row
- Query a result given an event name, year, and medal type
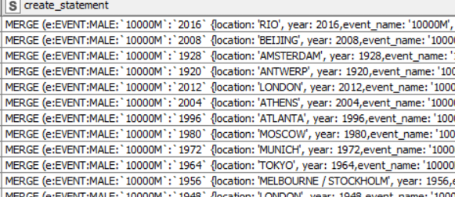
To address #1, we need to successfully query results of an event over time.
For example, we can produce a table of all medal-winning results of the female shot put since 1970.
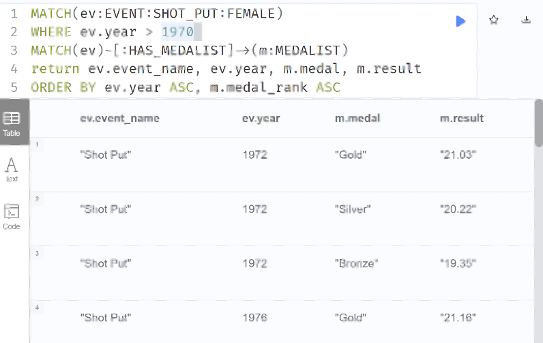
Image 3
To answer another possible question of the data, who was the first athlete to break the eight-foot barrier in the long jump, and where/when did this occur?
Query results indicate it was none other than the incomprable Jesse Owens!
Image 4
To create a medal count table by country lets attempt to show the count of each medal type for France during the years of 1935-1960 (exclusive).

Image 5
To athletes who medaled in the same event multiple games in a row we will look at the last five times an athlete medaled in the same event three times successively.
Perhaps unsurprisingly, Usain Bolt appears on this list…twice!
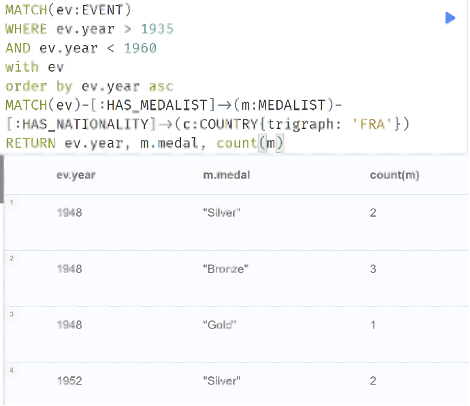
Image 6
Finally, and perhaps most simply, given an event name, year, and medal type, return the athlete and their result.
Due to the unique labelling of events, a year, event name, and the gender of the athletes uniquely identifies the event node, then it is simply a matter of pulling the linked medalist of the correct medal type.
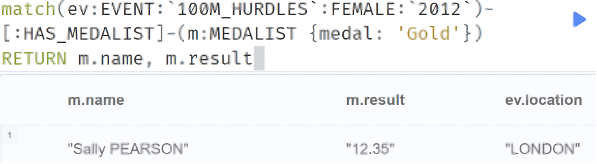
Image 7
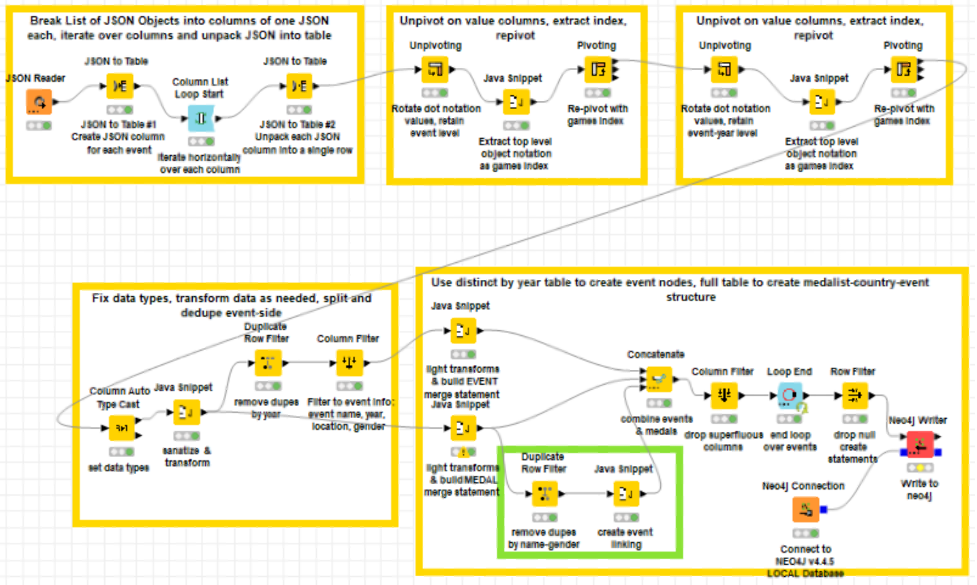
Complete Workflow
Alibis & Errata
Keen observers will notice that I left event results as strings data types. The different types of result data prevented any singular data type from containing all result data (doubles for field events, time for track events), and a few inconsistencies in the data convinced me to leave conversion out of this effort. Perhaps the best way to address this issue would be a conversion of time values into neo4j’s duration data type, which allows for millisecond level precision if needed. The data held no units for the results and requires research to provide the precision for each event’s time value.
References
Neo4j documentation:
- https://neo4j.com/developer/kb/creating-and-working-with-linked-lists/
- https://neo4j.com/docs/cypher-manual/current/syntax/temporal/#cypher-temporal-durations
Olympic Data set:
- https://www.kaggle.com/datasets/jayrav13/olympic-track-field-results?resource=download&select=results.json
Michael Rogers is an Analytical Engineer at BigBear.ai. He has several years of experience with ETL programming with KNIME and neo4j database design.
