Bridge Tables – Deep Dive
This is the third and final blog a part of my deep dive series for dimensional modeling. Today, I will focus on Bridge Tables in this post.
Bridge tables are dimensional tables needed to address the many to many relationships between facts and dimensions or dimensions and multi-valued attributes you may come across when modeling your star schema.
Multi-Value Dimensional Attributes
Let’s start with the dimensions containing descriptive attributes that can have multiple values. For example, an employee skills relationship. In a relational model (Figure 1), the employee skills would be a single lookup table with a joiner table to show the relationship between the employee and the skills that they possess.

Figure 1. Relational Logical Model
Although this works perfectly in relational modeling, this will not work in dimensional modeling as one to many (1::M) relationships do not work the same way in a dimensional model. The reason why we try to eliminate the 1::M relationships in dimensional models, the detrimental impact on the performance of queries. Therefore we have to remove the 1::M relationships in dimensional models, but how?
One way in which we do this is through denormalization. To do this using the relational model above, we would add a flag attribute for each skill in the skill table.
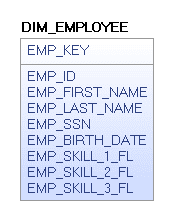
Figure 2. Denormalized Employee/Skill Model
This is a perfectly acceptable solution if the list of skills is relatively static. The challenge with this solution is that it doesn’t scale when I add attributes dynamically. If I were to add ten new skills to the skill table in the relational model, I would need to add 10 new flag attributes into the DIM_EMPLOYEE table manually and I need to adjust the ETL workflow to be able to handle these new attributes.
The preferred dimensional modeling solution would be to use an attribute bridge table to connect the list of skills, a separate dimension table (outrigger), to the employee dimension by creating groups of skills. Although the model looks similar to the relational model, there are subtle differences between the dimensional logical model in Figure 3 vs. the relational model depicted in Figure 1. As you can see in Figure 3, the bridge table (BR_SKILL_GRP) will contain all of the combinations of the skills included in the outrigger (OR_SKILL) table with each combination of skills given a unique SKILL_GRP_KEY. The employee dimension would contain a specific skill group key that would uniquely identify the group of skills the employee possesses.

Figure 3. Dimensional Logical Model
A group of five skills would have 32 unique SKILL_GRP_KEYs and a total of 81 records. The data would look like Figure 4.
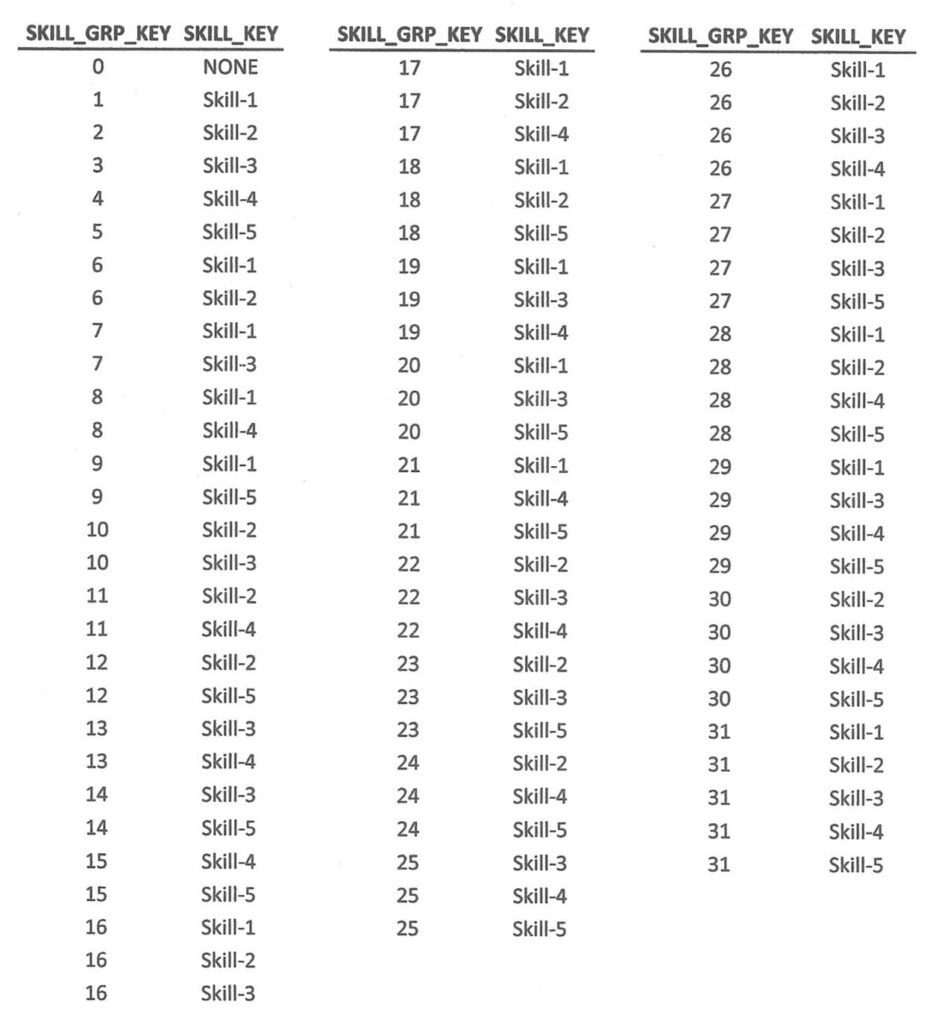
Figure 4
This solution does add complexity to the ETL loading process as we need to ensure the correct SKILL_GRP_KEY is entered in the DIM_EMPLOYEE table, and the proper skill group key is associated with the appropriate employee. Also, this solution may cause query performance issues and challenges when using some BI tools. Custom reporting solutions may be needed to properly filter and group results when using this bridge and outrigger solution.
Multi-Value Dimensions
The other type of many-to-many relationships we encounter in dimensional modeling is when several dimension records are associated with a single fact record. The challenge is similar to the multi-value attributes. In both models, we need to eliminate the redundancy in the model to ensure we do not overcount our fact records while providing a way to group and filter our results accurately.
Having worked in publications in the past, I like to use the article pageview fact as our example. The article pageviews count the number of times an article was viewed, but we also want to see which authors have the most pageviews. The challenge is that most articles are written by more than one author. How can we accurately count the total pageviews by author?
Figure 5 shows the relational, logical model between the Arthur, Article, and Pageviews.
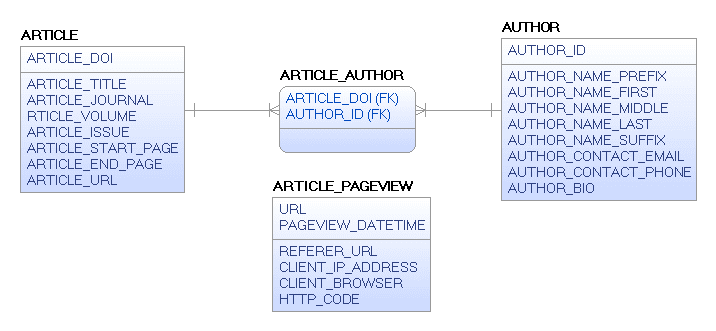
Figure 5.
Now we want to take this information into a dimensional model for reporting. If we add an author key directly to the FACT_ARTICLE_PAGEVIEW as depicted in Figure 6, we will overcount any article that has multiple authors because the relationship between article and author is many to many.
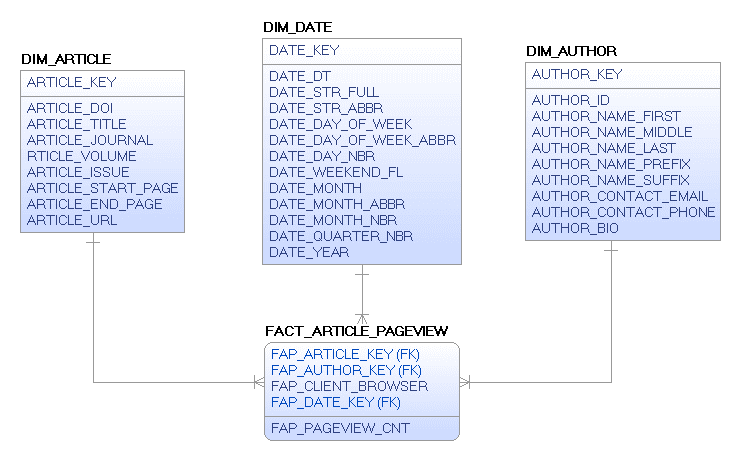
Figure 6.
Because of this many to many relationship we need to find a way to eliminate the author from the fact table while retaining the ability to provide counts by authors. To do this, we will need to create a bridge to group authors for each article. The good thing about this example is that the list of authors rarely changes after publication, so once the author group is created for a specific article, it shouldn’t change. Figure 7. shows the dimensional model that would optimally be able to answer the question of which author had the most pageviews. I also added an allocation percentage in the event the customer wanted to give each author a portion of each pageview based on the number of authors.
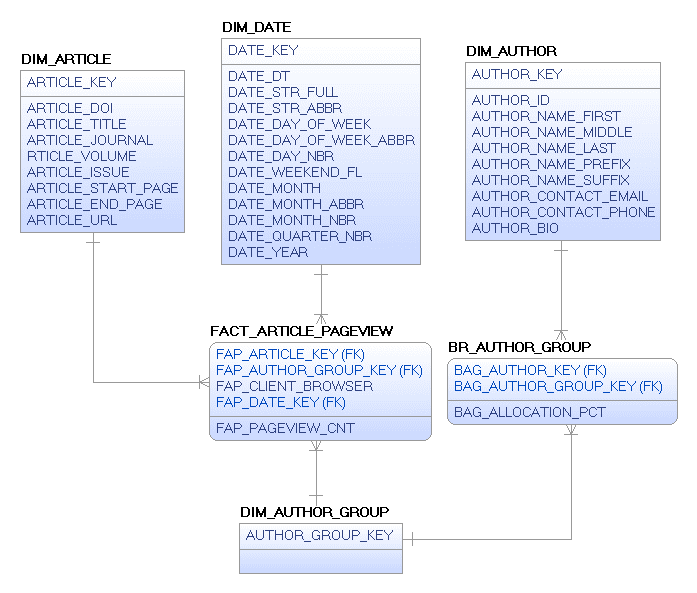
Figure 7.
In conclusion, bridge tables both add and subtract complexity from our dimensional data models. The models expand, our ETL becomes a little more complicated, and the queries will have more tables to join, but the result will be accurate, and that is what our customers expect.
I hope you found this three-part deep-dive series on dimensional modeling challenges informative and useful.

