Drilling Down / Drilling Through (Across)
You often hear “drilling down” and “drilling across” from business intelligence professionals, but what does it mean and how do you, as a data modeler, design for this requirement? This blog post will provide you with insights on how to do this.
To drill down means to decompose fact data via hierarchical dimensional attributes. Time and geography (location) are good examples of hierarchical dimensions. In a complete time dimension, you will have the day, month, quarter and year hierarchy. In a geography dimension you may have a city, district, state, and region hierarchy. Consider your shown a dashboard with year to date (YTD) sales. You may want to decompose that data to look into the sales by quarter or by month to see if there is a trend in the data. Using that same fact data you may be presented with the overall sales in your company but want to research the sales by a smaller geographic area like state or district to see if there are any anomalies or trends happening that you may want to eliminate or take advantage of companywide.
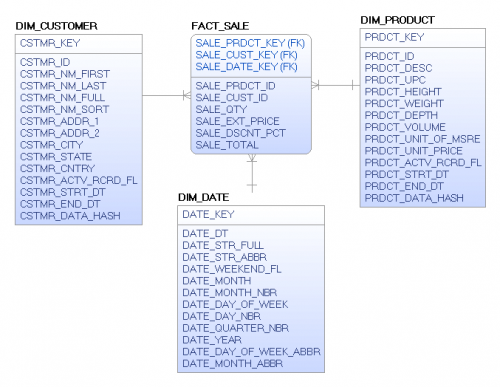
Figure 1 – FACT_SALE
Sum Yearly
SELECT DATE_YR_NBR
, SALE_PRDCT_ID
, PRDCT_DESC
, SUM(SALE_QTY)
, SUM(SALE_TOT)
FROM FACT_SALE
JOIN DIM_PRODUCT ON SALE_PRDCT_KEY = PRDCT_KEY
JOIN DIM_DATE ON SALE_DATE_KEY = DATE_KEY
WHERE DATE_YR_NBR = 2019
GROUP BY DATE_YR_NBR, SALE_PRDCT_ID, PRDCT_DESC
ORDER BY SUM(SALE_TOT) DESC;
Sum Quarterly
SELECT DATE_QTR_NBR
, SALE_PRDCT_ID
, PRDCT_DESC
, SUM(SALE_QTY)
, SUM(SALE_TOT)
FROM FACT_SALE
JOIN DIM_PRODUCT ON SALE_PRDCT_KEY = PRDCT_KEY
JOIN DIM_DATE ON SALE_DATE_KEY = DATE_KEY
WHERE DATE_YR_NBR = 2019
GROUP BY DATE_QTR_NBR, SALE_PRDCT_ID, PRDCT_DESC
ORDER BY SUM(SALE_TOT) DESC;
Sum Monthly
SELECT DATE_MONTH_NBR
, SALE_PRDCT_ID
, PRDCT_DESC
, SUM(SALE_QTY)
, SUM(SALE_TOT)
FROM FACT_SALE
JOIN DIM_PRODUCT ON SALE_PRDCT_KEY = PRDCT_KEY
JOIN DIM_DATE ON SALE_DATE_KEY = DATE_KEY
WHERE DATE_YR_NBR = 2019
GROUP BY DATE_MONTH_NBR, SALE_PRDCT_ID, PRDCT_DESC
ORDER BY SUM(SALE_TOT) DESC;
Sum Daily
SELECT DATE_KEY
, SALE_PRDCT_ID
, PRDCT_DESC
, SUM(SALE_QTY)
, SUM(SALE_TOT)
FROM FACT_SALE
JOIN DIM_PRODUCT ON SALE_PRDCT_KEY = PRDCT_KEY
JOIN DIM_DATE ON SALE_DATE_KEY = DATE_KEY
WHERE DATE_KEY = 2019
GROUP BY DATE_MONTH_NBR, SALE_PRDCT_ID, PRDCT_DESC
ORDER BY SUM(SALE_TOT) DESC;
To drill through (or across) is a way to provide additional information about a data element contained within a report. These reports are separate and distinct reports that are opened using data provided by the current report and contain detailed information about an item in the calling report. Finally, because these reports can stand-alone, they are rendered only when the user clicks the drill through link contained in the related report. An example of this may be when I have drilled down on my sales data to a specific day. Here I may be able to see all of the individual sales invoices for that day. If I wanted to see an individual sales invoice, I could then call the existing Display Invoice link passing the invoice number I wish to see.
What do you have to do as a Data Modeler to address ensure the successful implementation of these requests? You must make sure that your hierarchies are setup correctly and contain all of the dimensional detail necessary. You don’t want to leave out a data element (like quarters in a date dimension) only to see it is needed in the future. Since the drill through requests are calling stand-alone reports you should not have the need to do any additional modeling to ensure that these reports can be rendered to the user.
I hope this provides you with a better understanding of these reports and the impact the data model has on these reports.
