Hierarchies & Graph Databases
I have started to think back on my previous data architecture solutions and think about if I was able to use a graph database as a full replacement or an enhancement to the designed architecture. So, I thought back to a solution I created for the US Army. This was an amazing project where my team created an enterprise data warehouse and reporting solution allowing senior leaders of the US Army know the readiness of any army unit, company, battalion, brigade, division, corps, and field army at any time. As you can see there is a hierarchy in the structure of the army, but that hierarchy isn’t static. For example, a company unit may have one battalion that it reports to operationally (OPCON) and another for how the unit reports via administrative functional areas (ADCON) and yet another for how the unit is controlled for the tactical use of combat support (TACON). When displaying these outputs, it is imperative to know which hierarchy you are describing.
To meet the reporting requirements in the data warehouse I built over 10 years ago I used a recursive query to create the hierarchy. The table was difficult to load and maintain and the queries were slow, but this solution met the customer’s needs. As I think about what I could change today using a graph database I would focus on replacing the hierarchal (self-referencing) table and recursive query with a set of graph nodes and a blazingly fast cypher script to retrieve the hierarchical data. Below is an example of a corps and some subordinate units. You will notice that the “select” script focuses on the relationship, not a node property. If I wanted to start at a location lower than the corps, I could then add a where clause to MATCH statement and retrieve the nodes from that point down.
MATCH (a)-[:ADCON]->(b)
RETURN a,b;
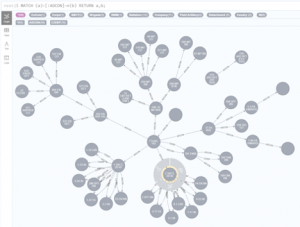
Figure 1 – ADCON
MATCH (a)-[:C2DEF]->(b)
RETURN a,b;
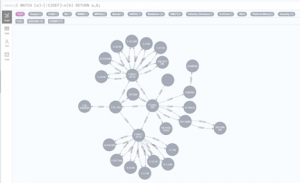
Figure 2 – OPCON
The graph database is easier to load and maintain and provides faster retrieval than the relational data structure. So much time that was lost in addressing the performance issues could now be easily addressed in this simple graph solution.
Node Relationships
The next place I would want to address is node relationships via direct or indirect connections between nodes in the graph. The example I will use here is what services will be impacted should we lose power. Because I may have services attached to a secondary power supply or a backup generator the answer isn’t as easy as one would think. Now we could have extra tables and or columns in the relational database to capture the secondary power source or the backup generator. But this is a sub-optimal solution because a system that is impacted and now off-line is no longer feeding data to the downstream systems that are still on-line thereby creating a degradation in service that one could not easily obtain. But with a graph DB, the answer can be found quickly, and the day-to-day maintenance of this information is trivial. Let’s look at an example of this using both databases.
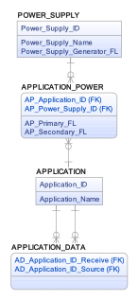
Figure 3 – Relational Application Power Supply
To obtain the downstream impact of a power supply issue for an application in Figure 4 using the relational data model in Figure 3 we need to join the application and the application_power and the power_supply tables. To find which applications need downstream data you need to recursively search the application table and then union the parent and children columns into a single column of IDs.
WITH application_list AS
(
SELECT ad_application_id_receive, ad_application_id_source
FROM application_data
START WITH ad_application_id_source in
(
SELECT ap_application_id from application_power ap
JOIN application a on ap.ap_application_id = a.application_id
JOIN power_supply ps on ap.ap_power_supply_id = ps.power_supply_id
WHERE ps.power_supply_name = ‘PECO Power Supply’
)
CONNECT BY PRIOR ad_application_id_receive = ad_application_id_source
)
SELECT ad_application_id_receive FROM application_list
UNION
SELECT ad_application_id_source FROM application_list;
As you can see, this is a complex select statement. It was hard to create and will be hard to maintain.
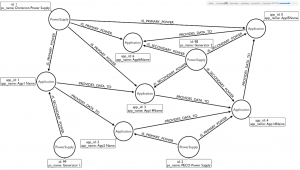
Figure 4 – Graph Application Power Supply
In Figure 4 we see the graph “data model”. It is relatively easy to understand and follow the node logic. To obtain the same information as we just did for the relational data structures we will run the following script:
MATCH (a:Application)
WHERE (a)-[:IS_PRIMARY_POWER]-(:PowerSupply {ps_name:’PECO Power Supply’})
AND NOT (a)-[:IS_SECONDARY_POWER]-()
RETURN (a)-[:PROVIDES_DATA_TO*1..]->()
This simple query will produce the correct answer of any application that is downstream of Application #2 (4, 5, and 6). This query also confirms that there is no secondary power (generator) that could be used to keep the application online.
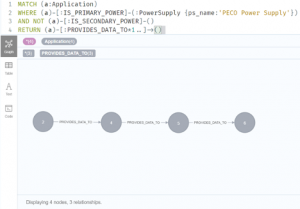
Figure 5 – Graph Query & Result
This same statement will work and display the correct results if there are additional applications connected to or downstream of application nodes 2, 4, 5, or 6 without any changes to the query or to the data.
I hope that I was able to describe some of my favorite features of graph databases and piqued your interest in adding this tool to your arsenal of data expertise. Please remember, graph databases are not a panacea, and they will not replace relational databases. But we need to begin to add graph databases as a part of our data architecture solutions where appropriate.
About the Author
Jim McHugh is the Vice President of National Intelligence Service – Emerging Markets Portfolio. Jim is responsible for the delivery of Analytics and Data Management to the Intelligence Community.
