Hierarchies in Qlik Sense
Understanding how Qlik’s Associative Engine handles hierarchies will improve your ability to render meaningful and flexible rollups that users can wield to draw insights at all levels of granularity. This article covers how Qlik hierarchies do not follow the same conventions as a normal database (SQL) and discusses how hierarchy and ancestry load functions can be used in tandem to allow easy access to data at any granularity.
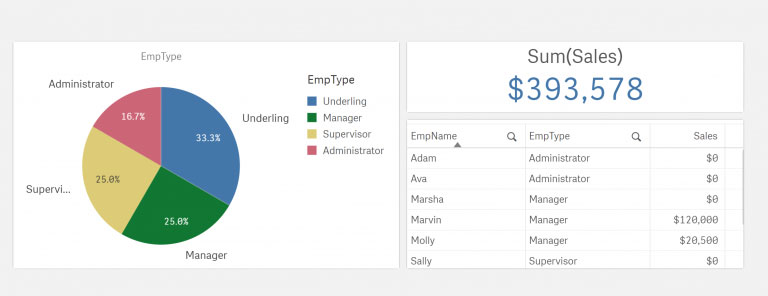
Figure 1: A dashboard containing sales data, to be used in hierarchy examples.
Database Hierarchies
Perhaps the most common way to store hierarchies in databases is through a Parent-Child Table. In such a table, there exists a row for each node in the hierarchy containing its ID and the ID of its parent. This format is widespread through most database technologies as it is simple, flexible, and updates quickly. Depending on the specific data, other formats may be used for better read/write performance.
Perhaps because of its ubiquity, Qlik is built to take utilize Parent-Child Tables. But it cannot provide a true hierarchical user experience without processing those tables through special functions.
The Qlik Associative Engine
Qlik cannot handle all features of hierarchies with just a Parent-Child Table. If a Parent-Child Table is loaded into a Qlik application, associations will only be visible for the selected node. For example, selecting a parent will select all its direct children (not grandchildren, great-grandchildren, etc.). Conversely, selecting a child will only select its direct parent (not grandparent, etc.).
This is because the Qlik Associative Engine can only relate fields to other fields; it cannot associate values in a field to itself without creating circular references. This behavior prevents Qlik from traversing a hierarchy in a straight Parent-Child Table. While it seems counter-productive to hierarchies, this approach grants the Qlik Associative Engine high performance.
Because of the Qlik Associative Engine, hierarchies in Qlik must exist in the data model supporting an application. Qlik has two Data Load Script functions that can build out data model hierarchy tables that support speedy dashboards. They both take in a Parent-Child table as the input parameter. Qlik developers intending on displaying hierarchical data should use one (or both) of these functions to meet the specific needs of the target dashboards.
Ancestry Table
The Qlik function HierarchyBelongsTo() creates an Ancestry Table. An ancestry table works much the same as a Closure Table in non-Qlik Databases: A table row will exist for each relationship between a parent and every node underneath it (including itself). Here’s an example of its input and output:
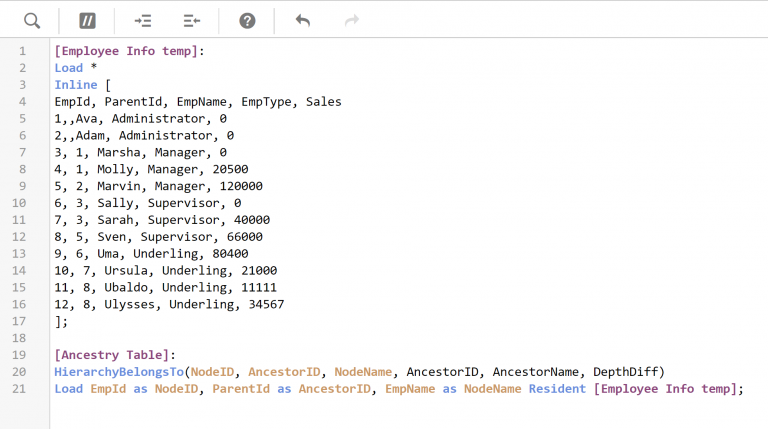
Figure 3: Input for the HierarchyBelongsTo() function.
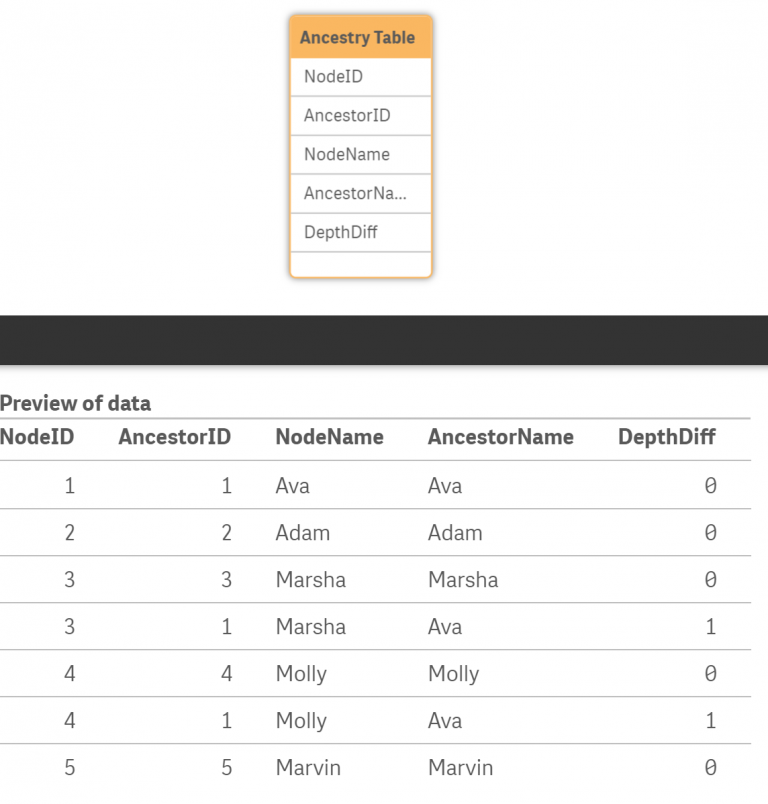
Figure 4: The resulting table of the HierarchyBelongsTo().
Before describing its usage, it should be noted that the Ancestry Table can be quite large (O(n^2)) in terms of rows. However, it is a relatively slim table, containing mostly IDs. The Ancestry Table is fast and responsive on dashboard thanks to Qlik’s Associative Engine, which now is looking through a simple association of two fields.
Selecting any ParentName on the dashboard will select all children underneath it, as well as itself. This allows users to view rollup information (ie: measures) for the Parent Node. The depth from the Parent Node to its furthest child is arbitrary under this approach. Because of this behavior, it will be useful to users to have a filter (or use the Smart Search) on the ParentName field, which should be well-named. In the example for this document, the ParentName field is renamed to Rollup Emp.
If the Data Model is mimicking a relational database, the NodeID should associate to the central Fact Table. It is recommended to keep this ID named separately from the actual ID of the Fact Table, so that measures (ie: counts) will not be influenced by the Ancestry Table.
Note that it is not possible to drilldown through an Ancestry Table, as that would require an association to itself.
Hierarchy Table
The Qlik function Hierarchy() creates a Hierarchy Table. The Hierarchy Table functions almost like a pivoted version of the Ancestry Table; instead of having a row for relationships at every depth, columns are used to represent relationships at specific Levels. The resulting table has a row for each Child Node and a column for each Level of the hierarchy tree. The Hierarchy Table hosts a clear readable path from the child to the root of the tree. Sample input and output are shown below:
The Hierarchy Table has as many rows as there are children in a hierarchy. It also has a column for each level in the hierarchy. The deeper the hierarchy tree, the more columns are needed to represent it in the Hierarchy Table.
The value in Hierarchy Table columns may be null if a child is closer to the root. For example, Molly’s node has a null value at level NodeName3 because Molly is a Manager and has no Supervisor, which would be listed in NodeName3’s column. As with the Ancestry Table, it takes up more space than a Parent-Child Table, but Qlik handles it generally well.
Creating a Hierarchy Table is particularly well suited for drilldown Master Dimensions. If the Levels from the previous screenshot are renamed and put into a drilldown Master Dimension, users are easily able to traverse tree and identify what Level they are at. Creating filters for each Level—or even just important Levels—can also assist users with this. Hierarchy Tables allow users to know what Level they are at in a hierarchy as they traverse it.
Because there is a one-to-one relationship between rows in the Hierarchy Table and rows in the Fact Table, they could be joined for small performance improvements. As with the Ancestry Table, renaming the fields that will be presented to the user is necessary for user-friendliness.
It should be noted that the Hierarchy Table works best if values in a given Level are related (ie: in the pictured examples, all Emps in NodeName2 are Managers). If there is arbitrary “steps” between two major Levels (ie: if there were n sub-Supervisors between a Supervisor and an Underling), a change in approach is required; an Ancestry Table could be used, or the data could be edited to only include major Levels.
Which Approach to Use?
Both hierarchy functions have advantages. The Ancestry Table is suited for trees of arbitrary depth where the user does not need to know what level of the tree is being displayed. The Hierarchy Table is suited for drilldowns where values at in a specific Level are related (ie: in the pictured examples, all Emps in NodeName3 are Supervisors). Choose whichever approach best suits the target data.
It is very possible to use both the Ancestry Table and the Hierarchy Table at the same time. While it does take up more space in the data model, it gives users the best of both worlds: they can drilldown through specific labeled Levels, or switch to view rollup information at arbitrary depth. The following data model and code show how to utilize both the Ancestry Table and the Hierarchy Table simultaneously.
// Create central fact table (inline).
 [Employee Info temp]:
 Load *
 Inline [
 EmpId, ParentId, EmpName, EmpType, Sales
     1,,Ava, Administrator, 0
     2,,Adam, Administrator, 0
     3, 1, Marsha, Manager, 0
     4, 1, Molly, Manager, 20500
     5, 2, Marvin, Manager, 120000
     6, 3, Sally, Supervisor, 0
     7, 3, Sarah, Supervisor, 40000
     8, 5, Sven, Supervisor, 66000
     9, 6, Uma, Underling, 80400
     10, 7, Ursula, Underling, 21000
     11, 8, Ubaldo, Underling, 11111
     12, 8, Ulysses, Underling, 34567
 ];

 // Use HierarchyBelongsTo() to create Ancestry Table.
[Ancestry Table temp]:
HierarchyBelongsTo(NodeID, AncestorID, NodeName, AncestorID, AncestorName, DepthDiff)
Load EmpId as NodeID, ParentId as AncestorID, EmpName as NodeName Resident [Employee Info temp];

 // Keep applicable fields, and rename AncestorName for user-friendliness.
 // NodeID will join to the fact table later.
[Ancestry Table]:
Load
     NodeID,
     NodeName,
     AncestorID,
     AncestorName as [Rollup Emp],
     DepthDiff
 Resident [Ancestry Table temp];

 // drop temp table.
 drop table [Ancestry Table temp];

 // Use Hierarchy() to create Hierarchy Table.
[Hierarchy Table]:
Hierarchy(NodeID, AncestorID, NodeName, ParentName, NodeName, PathName, '', Depth)
 Load EmpId as NodeID, ParentId as AncestorID, EmpName as NodeName Resident [Employee Info temp];

 // Create final Fact Table, duplicating EmpId as NodeID so that the Ancestry Table can join to it
 // without complicating its measures (ie: count of EmpIds).
[Employee Info]:
Load
     EmpId,
     EmpId as NodeID,
     EmpName,
     EmpType,
     Sales
 Resident [Employee Info temp];

 // Drop temp fact table.
 drop table [Employee Info temp];

 // Join relevant Hierarchy Table fields to central fact table, renaming for user-friendliness.
 Left Join([Employee Info])
 Load
     NodeID,
     NodeName1 as Administrator,
     NodeName2 as Manager,
     NodeName3 as Supervisor
 Resident [Hierarchy Table];

 // Drop temp table.
 Drop table [Hierarchy Table];
