Let It Snow: Generating Fractal Snowflakes with KNIME
Continuing the holiday theme of my previous blog entry, today I decided to write a quick post on how to generate fractal snowflakes using KNIME, the industry leading open source data science platform. While I’d be comfortable coding this in any number of programming languages, the very nature of KNIME’s desktop application makes it simple to rapidly explore and visualize data in a way that lends itself to fun mathematical explorations for even non-programmers.
However, as with many data science tasks, in the midst of my explorations today I found myself confronted with anomalous results that I initially couldn’t explain. As a result, the nature of this blog posting changed: it is going to not just touch on some of KNIME’s sophisticated processing nodes but it will also show how subtle bugs can lurk even in a relatively simple processing workflow. Fortunately, the spirit of the season prevailed, and I was able to produce some perfect snowflakes.
The type of fractal snowflake I am generating is based on the Koch curve. The Koch curve is a mathematical curve that was one of the earliest forms of fractals first presented in a 1904 paper by mathematician Helge von Koch. Simplistically speaking, a Koch snowflake is generated by starting with a triangle and recursively placing a smaller triangle on each outer edge of the previous triangles three sides. This can be done an infinite number of times, hence the fractal nature of the shape: you ultimately have a shape with known dimensions but an infinite perimeter! For those who are interested in the actual math and theory behind the Koch curve itself, please see the Wikipedia article.
For my variation, I decided that instead of starting with the initial triangle shape of the Koch snowflake, my generator would support starting with a regular polygon with an arbitrary number of sides so that a wider variety of snowflake shapes could be built. Each side of the polygon would still be treated as a Koch curve, so the fractal mathematics stayed the same. Furthermore, I changed the math to generate what is referred to as an anti-snowflake. Instead of growing the fractal triangles outward, I made them grow inward as this produces a more snowflake like design in my opinion.
For those who wish to follow along and conduct further experiments, please download my exported workflow. The initial configuration for the snowflake generation is controlled by three parameters. These are set as workflow variables as follows:
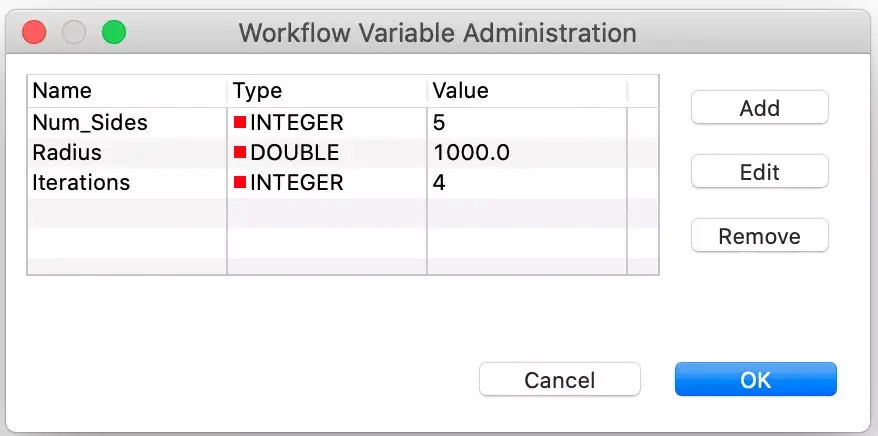
The settings are self-explanatory, but I will warn you to be cautious with how many iterations you try. Because each iteration of the Koch curve replaces one segment with four new segments, the total number of segments grows rapidly with each iteration.
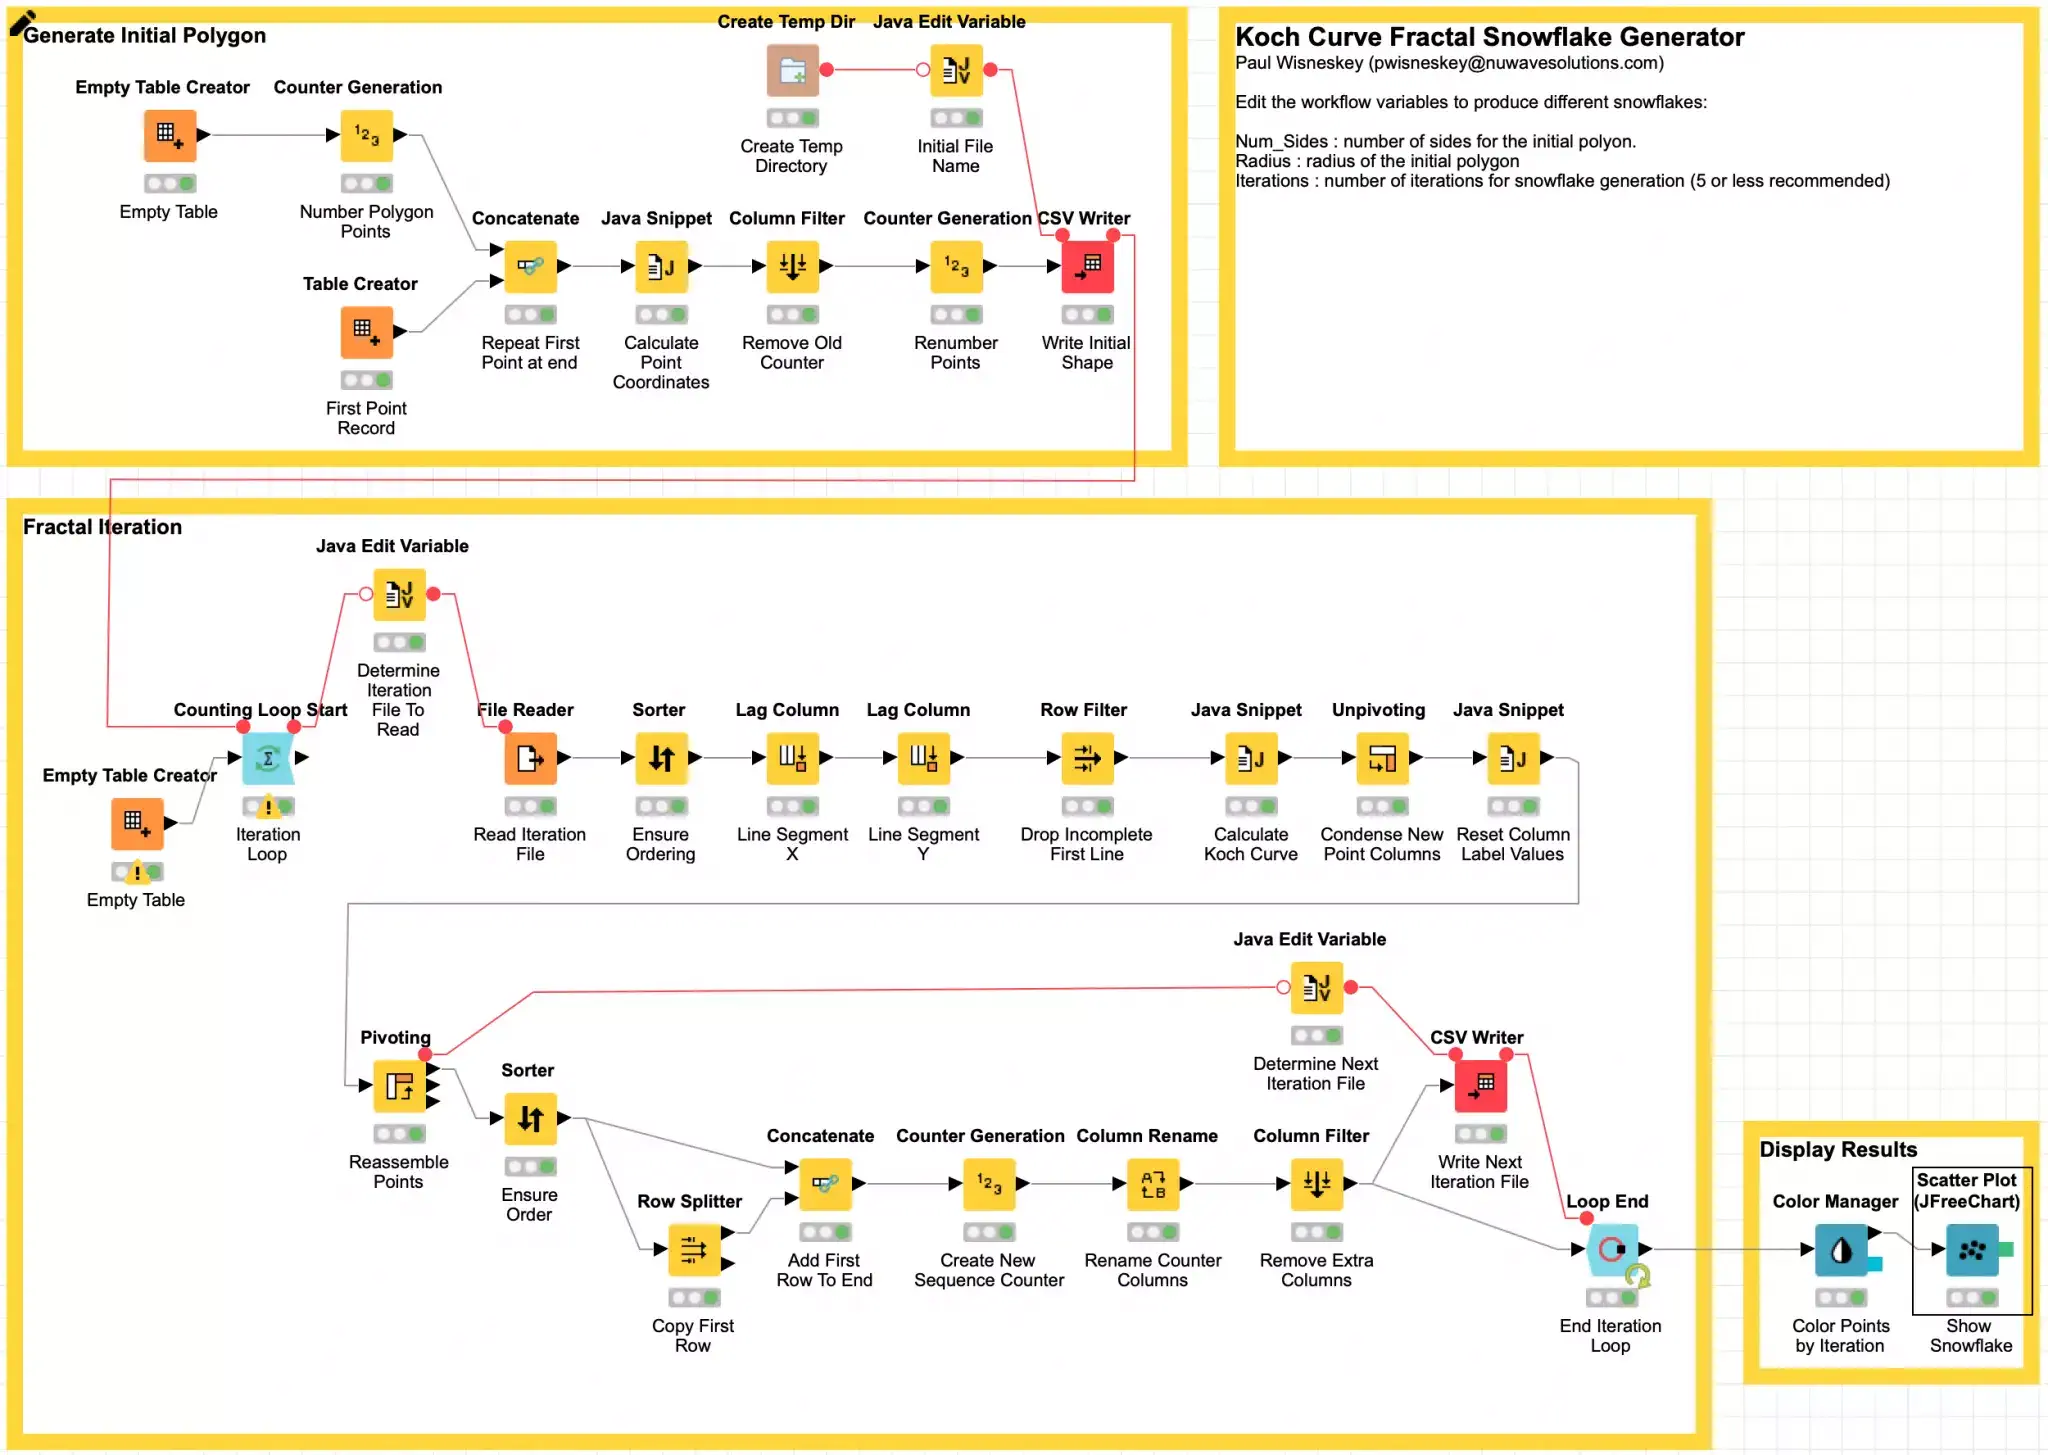
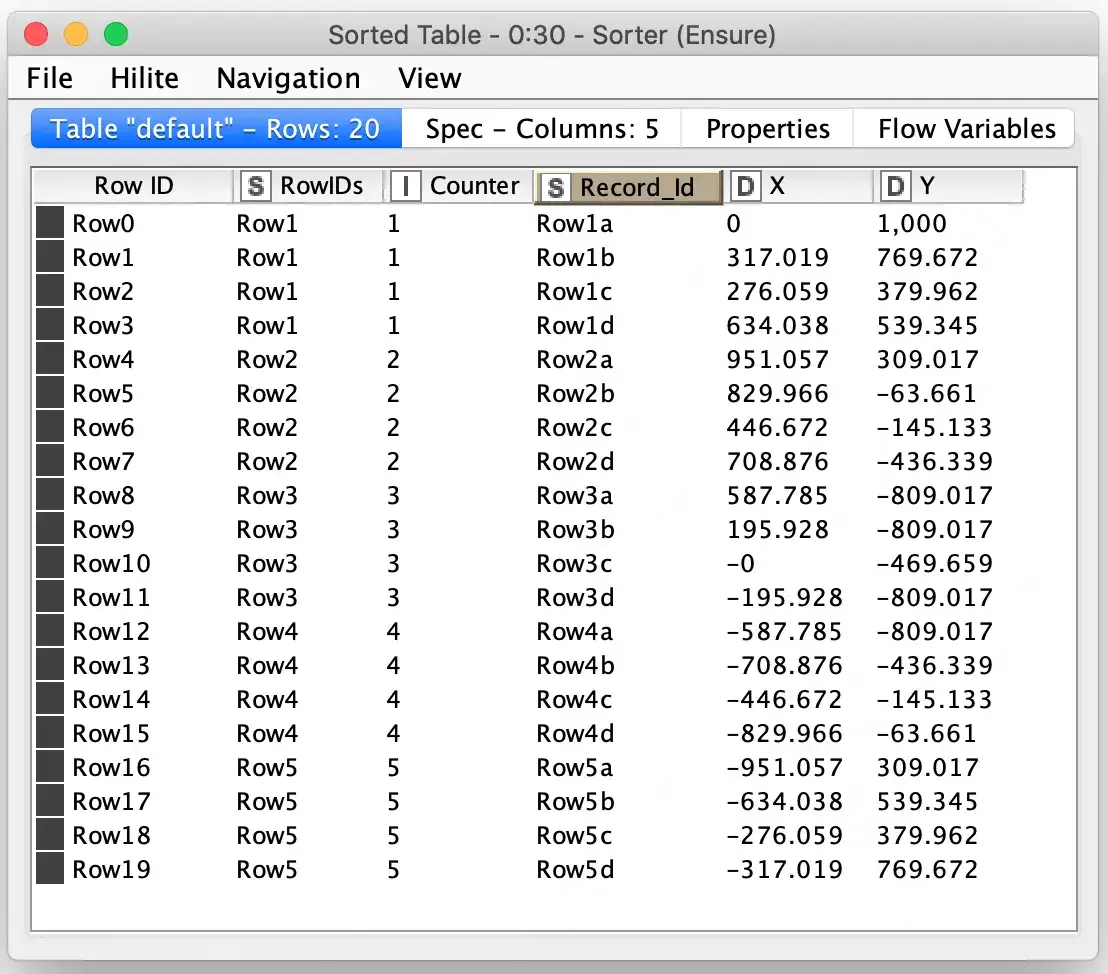
Programmatically generating a Koch curve is relatively straightforward and it is often done recursively in code. There are examples of the algorithm in many different languages here. However, KNIME workflows do not support recursion in the nodes: it would generate a feedback loop if the output of a node could flow back into an upstream node! Because of this, I designed my snowflake generator workflow to be iterative by having each iteration read from disk the results of the iteration before it. This also means that the first iteration file is generated at the start to just represent the initial regular polygon that will be grown into a snowflake. Each record simply consists of sequence number and two coordinates representing a point in the current snowflake polygon:
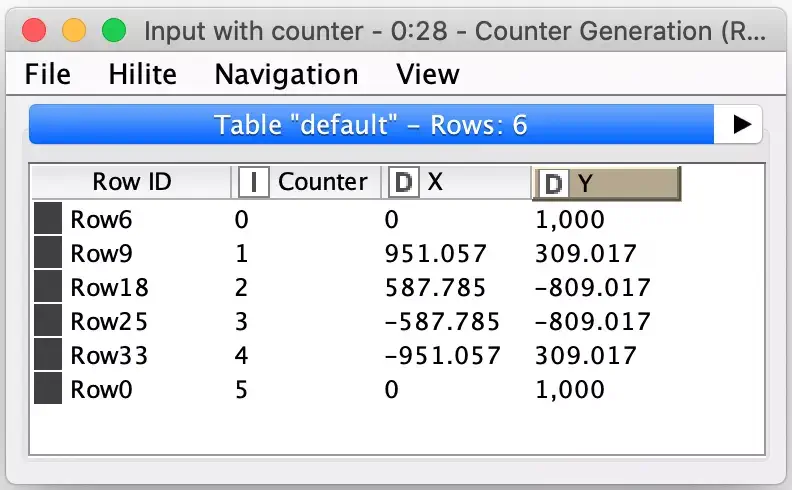
These are the sample points for the default five-sided polygon the workflow is configured with. One of the assumptions I make in the processing is that each side is represented in the data which means the starting point of the polygon appears first and last in the table so that the line segment that makes up each side is represented as a grouping of two rows in the table.
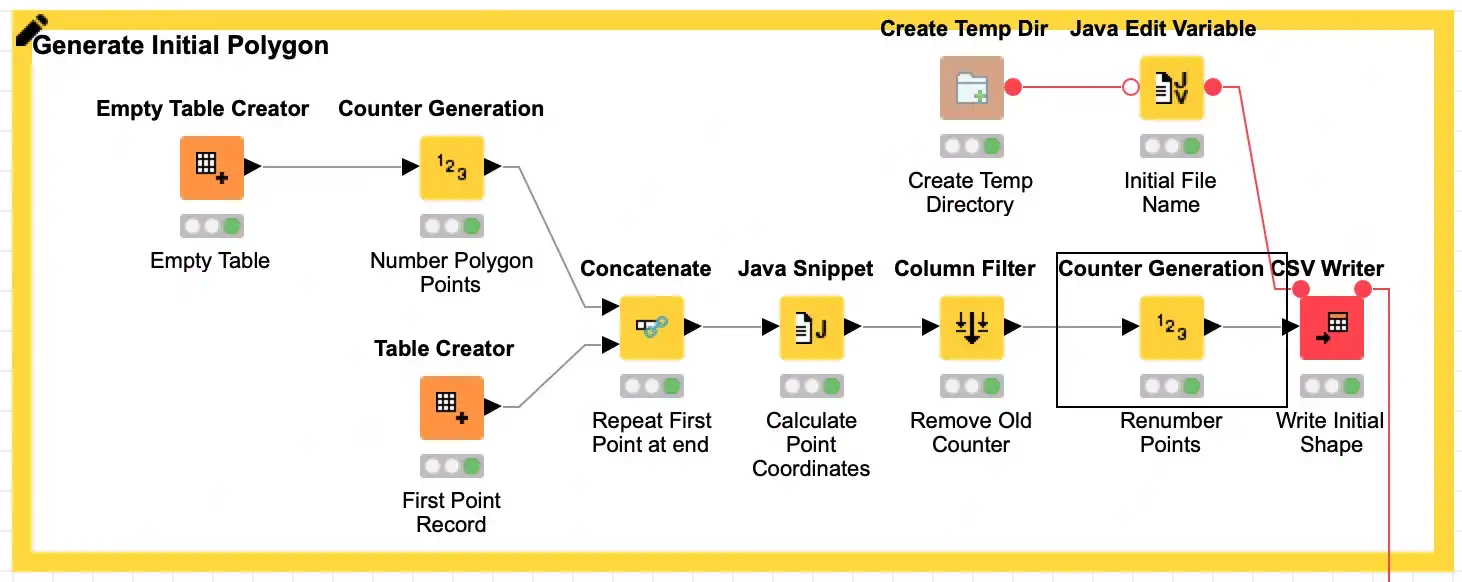
Here I will highlight the first KNIME node of this post, the Create Temp Dir node. This node creates a temporary directory for use by your workflow that is maintained with the stored node state in the workflow. It is a safe, easy way to ensure that you have an appropriate place to write data regardless of where your workflow is being run.
Once we have the initial shape’s coordinates written, we then loop for the desired number of iterations to read the source shape coordinates and then replace each segment in the source shape with the Koch curve for that segment. I am not going to get into many of the details of the processing loop, but I will highlight a few uses of particularly interesting nodes to deal with how we pivot wide records. I also encourage you to explore the workflow nodes on your own. In particular, the fractal math magic is all done in the Java Snippet node labeled Calculate Koch Curve.
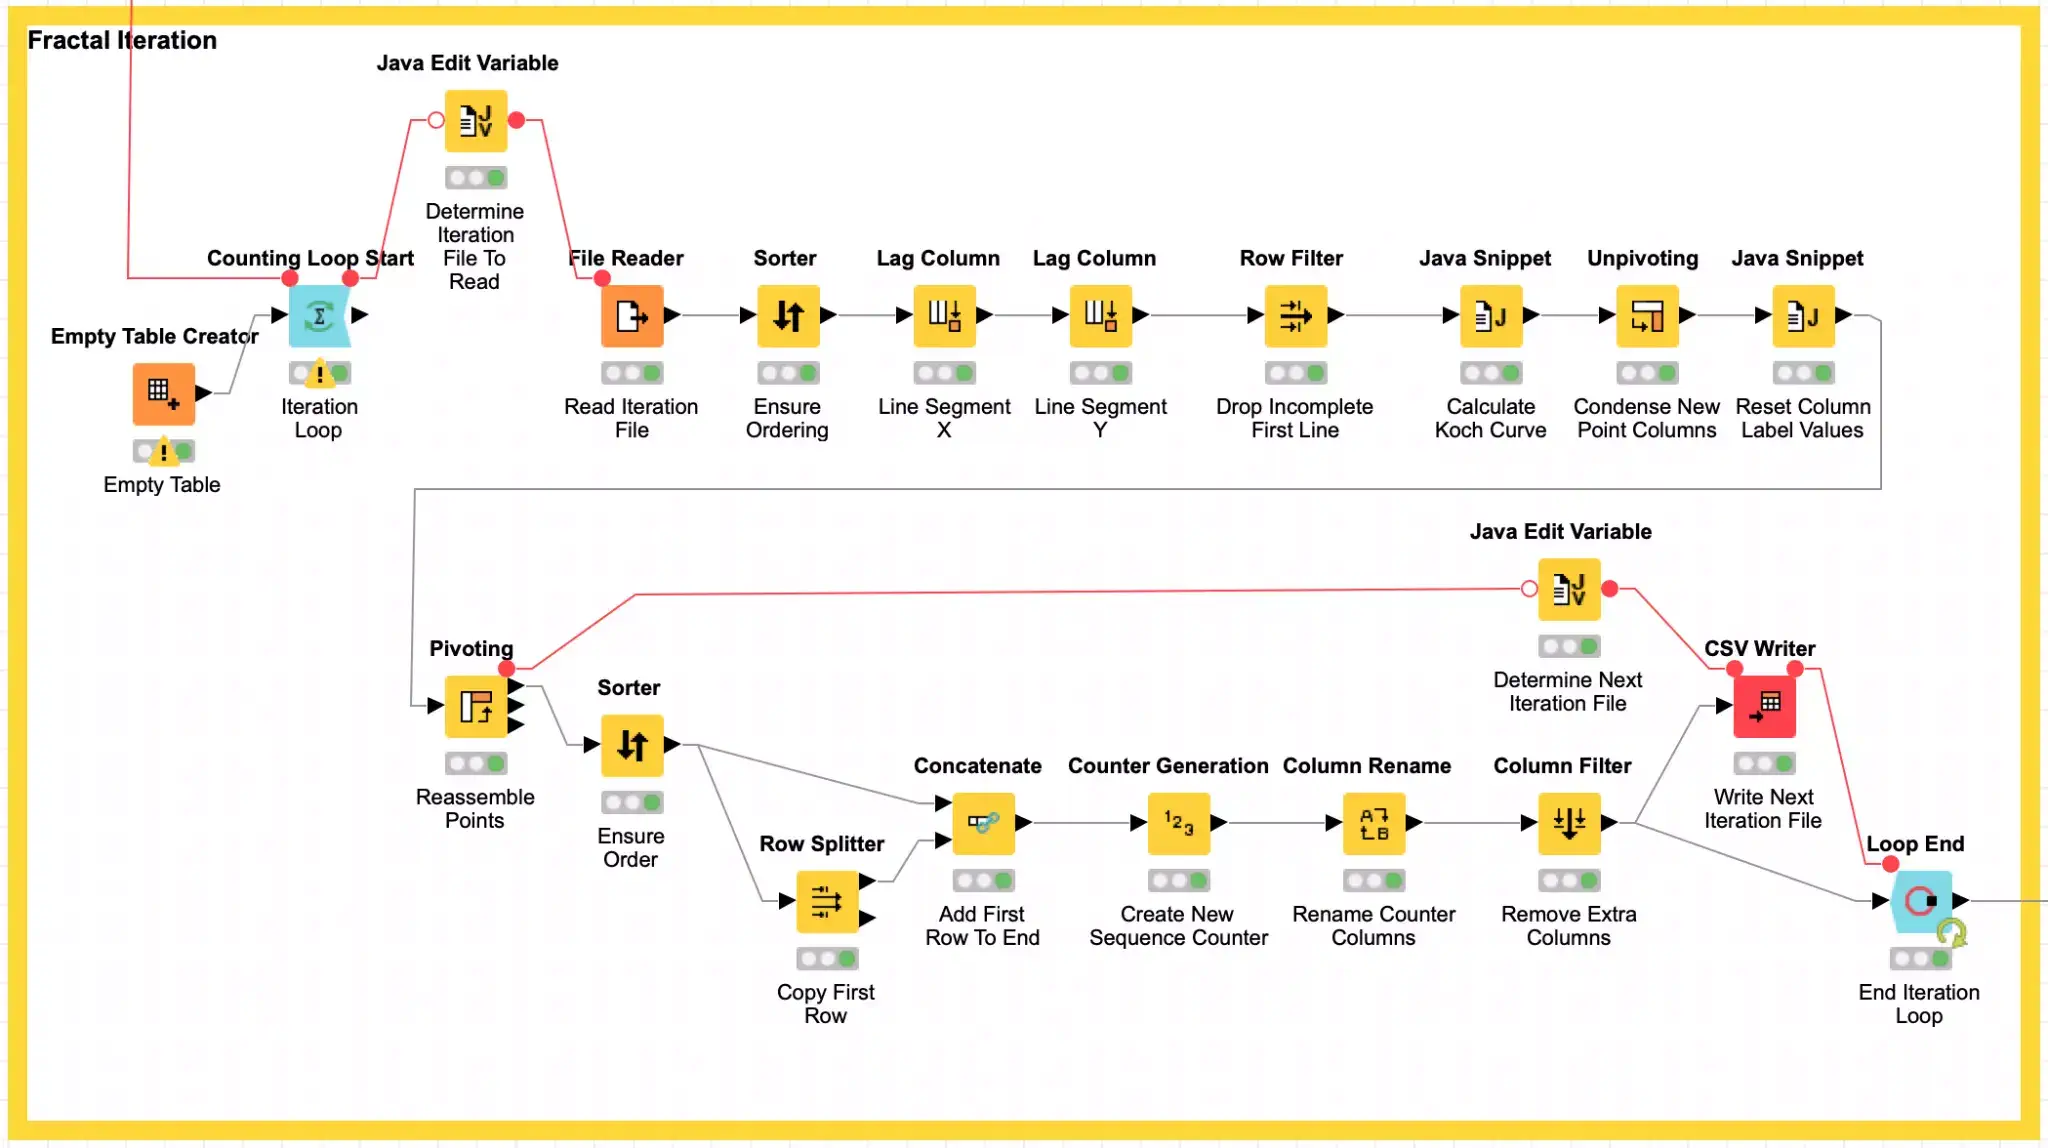
If you recall, our input data is a list of polygon points but the Koch curve equations require line segments which means we need starting and ending points for each segment. We do this by using KNIME’s Lag Column to replicate the X and Y column values from one record to the next record.
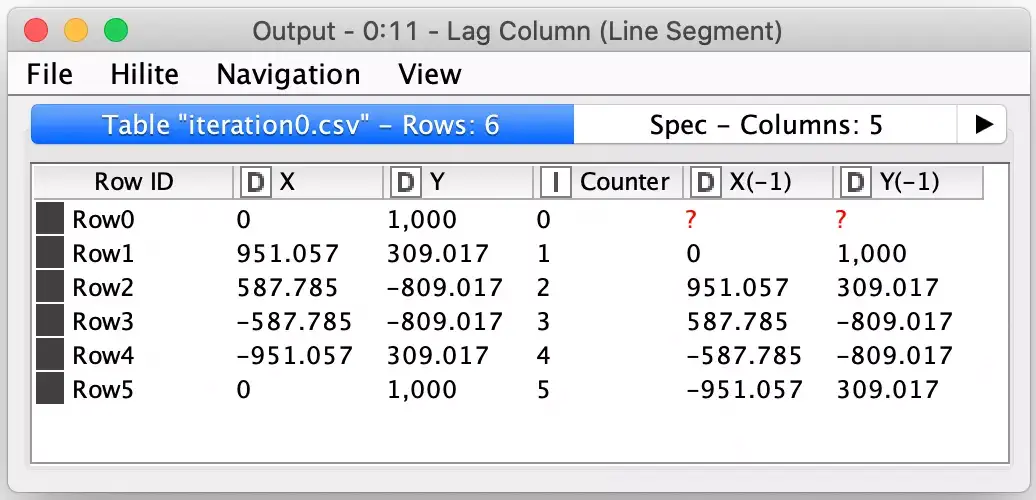
The Lag Column node is a very powerful node that is often used in generating time series values for machine learning. By using the node on both the X and Y columns, each row in our data now represents a complete line segment with the exception of the first row which is incomplete because there was no prior record. We can simply filter this row out using a filter configured to screen for missing values.
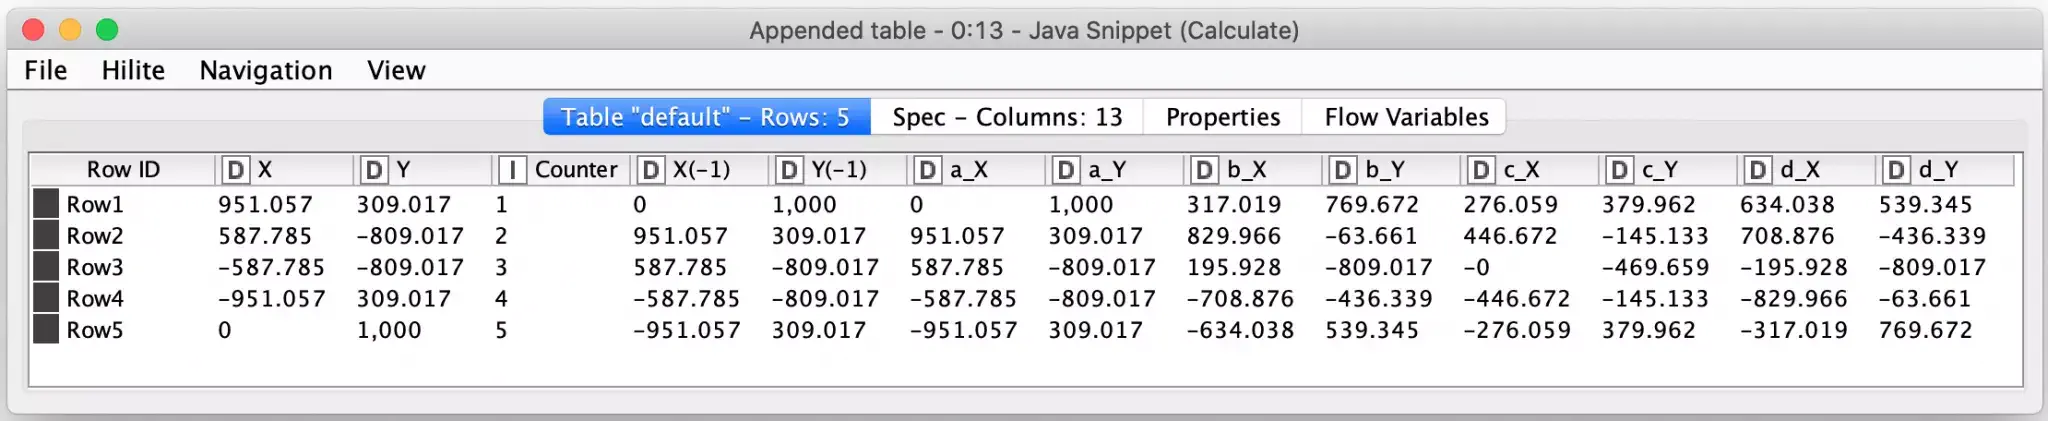
The remaining rows are then processed via a Java Snippet Node which calculates the new line segment points for the Koch curve that fits the row’s line segment. These are all output as new points in the same row:
In order to get these wide rows turned back into a list of points, I employ the very powerful Unpivot node to convert these columns into their own labeled rows and then edit the labels to change each row’s label into either an X or Y so that the data can be then be processed with the Pivot node to turn it back into a row containing a single point record while maintaining the appropriate order of the points. The ordering is maintained via the use of secondary columns to track the source row and maintain the sequencing of each point to match what it was in the wide row of points (via the Record_Id column.)
After that, the extra columns are removed, and a new continuous sequence number is generated for the ordered points. And finally, the points are written back to our temporary directory so that they may be used as the source points for the next iteration of processing.
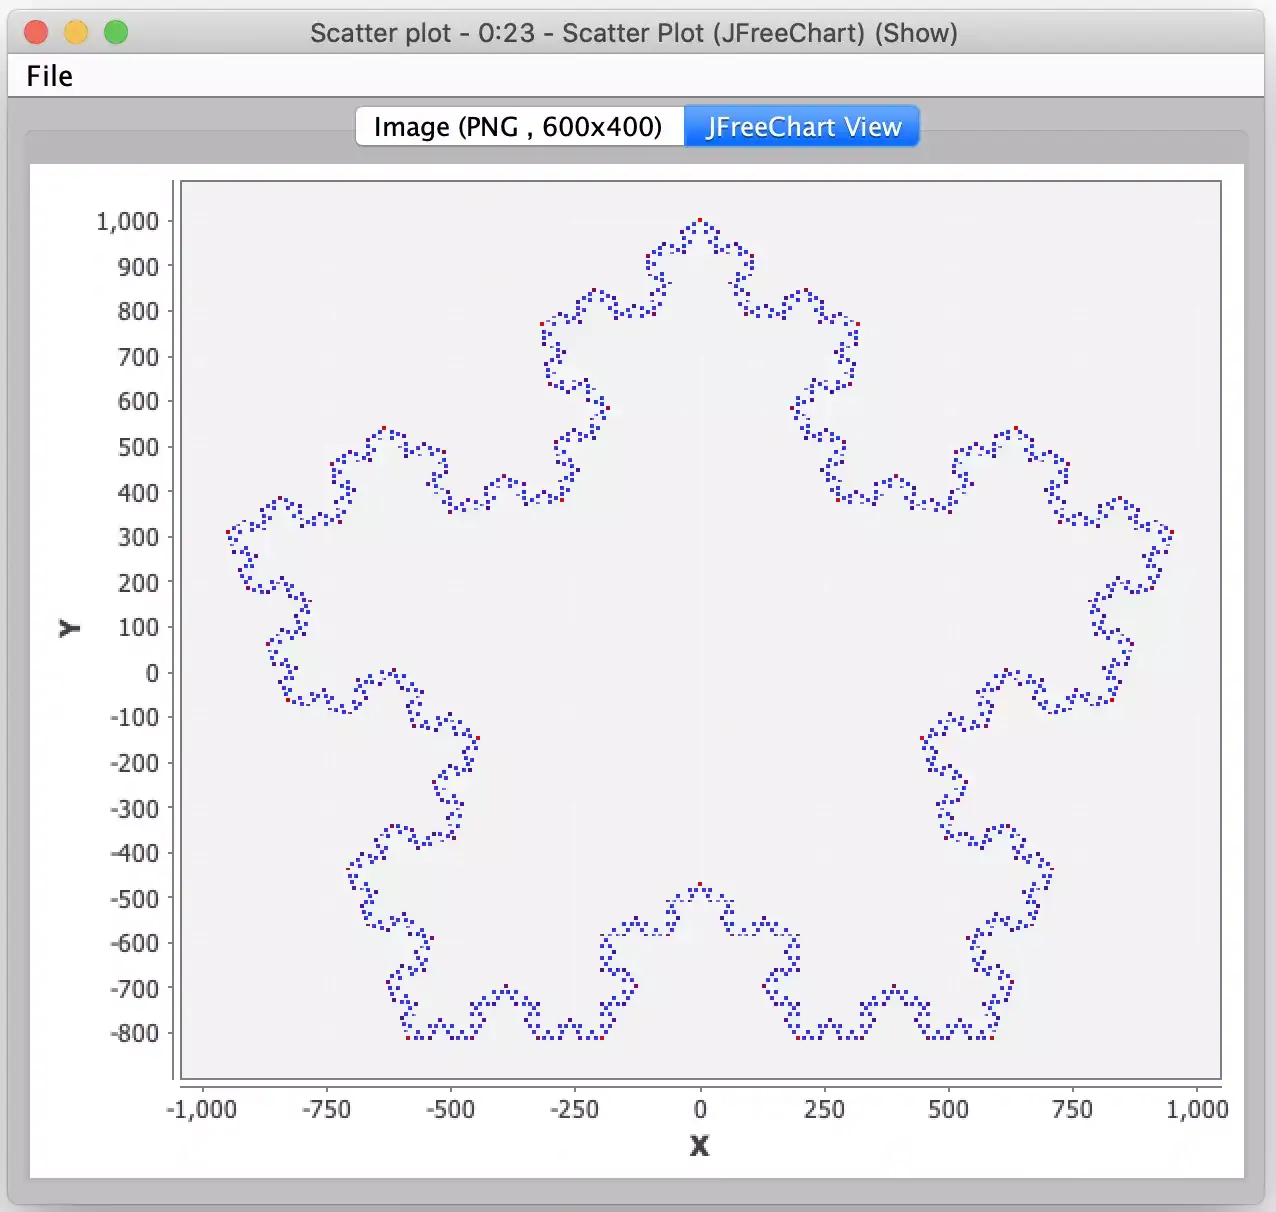
At the end of the configured number of iterations, we then visualize the results that were produced. And here is where you may get surprised by the Loop End node. This node is designed to accumulate the results of each of its iterations so the output from the Loop End node is not just the last iteration’s points but all points from each iteration (hence why I warned your earlier about not trying too many iterations!) Fortunately, this is what I wanted because in the final visualization I can then color each iterations’ points with its own color which makes for a more interesting snowflake and helps visualize the effects of each iteration of the generation process. For the actual visualization, I use KNIME’s Scatter Plot node to plot each point. By using this node’s JFreeChart View, you can also explore the data by zooming in on areas of interest.
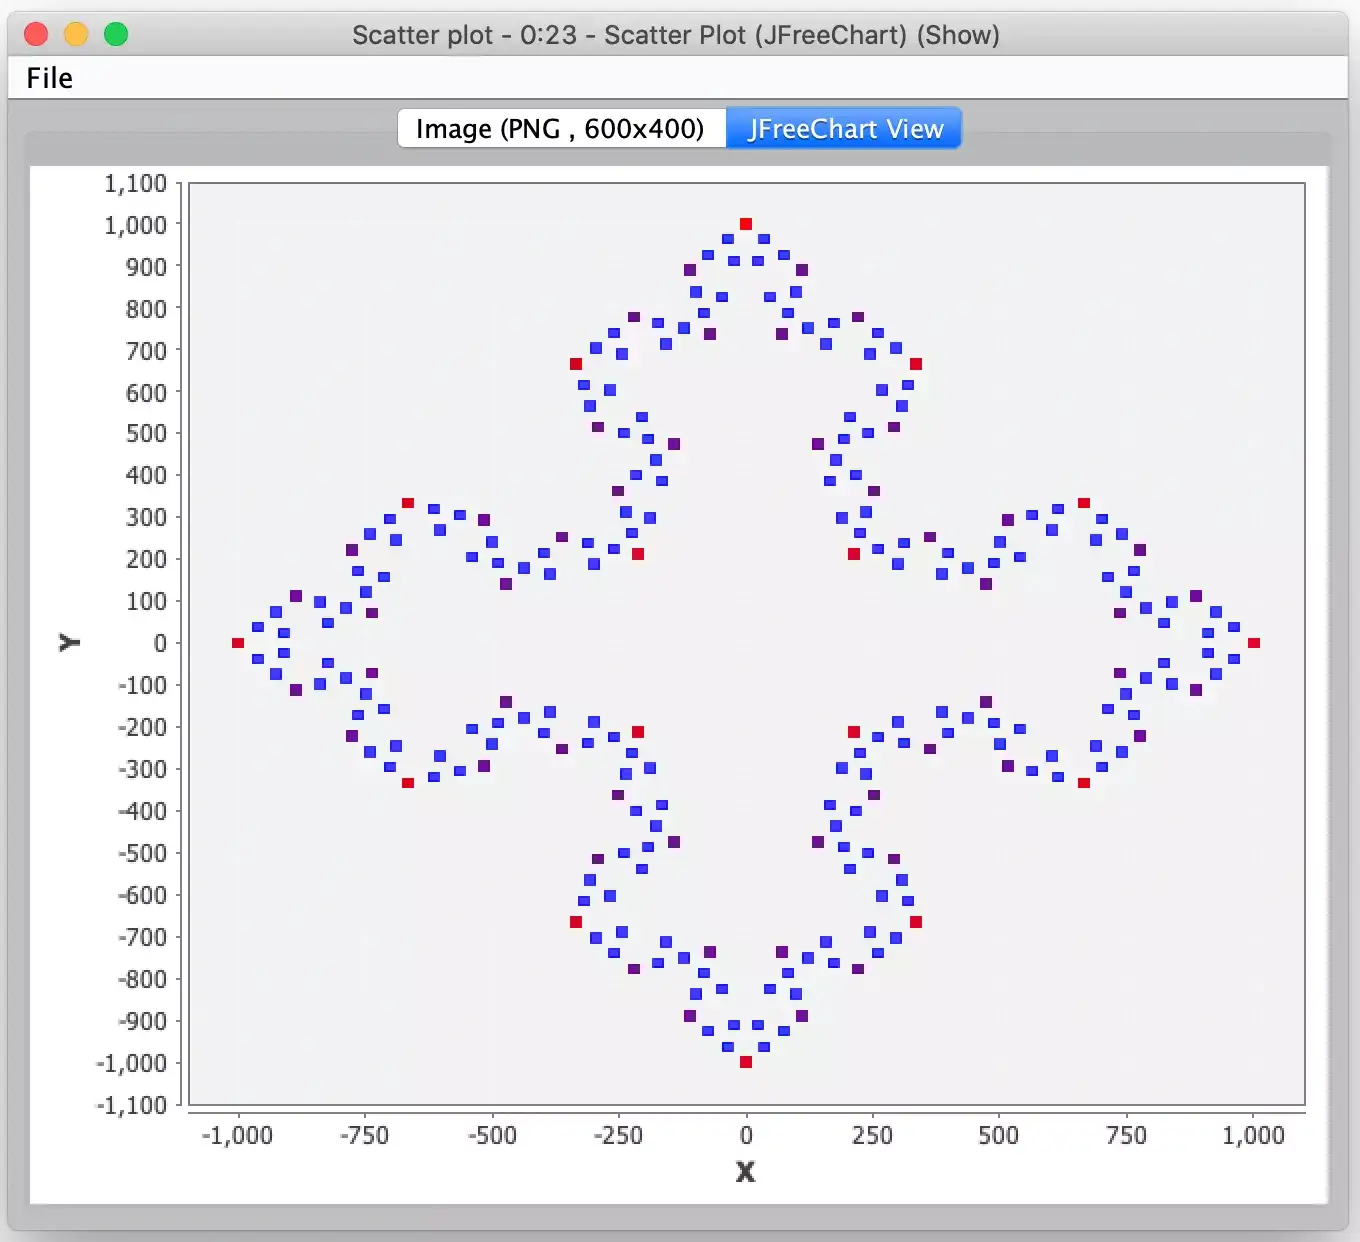
Looks good, right? But I mentioned anomalous results in my introduction, and they didn’t occur during my initial development. Once I had the workflow built and tested using a few simple polygons and a few iterations of snowflake generation I started to experiment with larger polygons and more iterations of processing. It was then I quickly started to see points out of place and unexplained gaps in the snowflake pattern.
Fortunately, I was visualizing something with symmetry, so it was readily apparent to me that something was off. Had this been more complex data, it might not have been so apparent if it was just subtly off. And this is a good lesson for someone working with data and its processing: as you develop the processing workflow, think about how you can validate each steps’ output, either as an integral part of the workflow or by building other external validation workflows. Fortunately, in my case I had each iteration’s output written to a temporary directory so I could gather clues about what went wrong.
I knew from coming up with the math formulas that there was no chance of a division by zero so my initial suspicion was a mathematical issue with rounding or underflow which could lead to the loss of precision required for an iteration. The first version of my workflow assumed a radius of 1.0 for the polygon generation so I introduced the configurable radius workflow variable to scale up the polygon to see if it was indeed a precision or underflow issue. It wasn’t.
My next thought was to check the iteration output files to see if it could be a numerical encoding issue when values were being written. In past data processing work, I have occasionally encountered issues when scientific notation is inadvertently being used when persisting data which causes issues when it is read back in. Fortunately, KNIME’s type checking is quite robust in this regard and I was quickly able to rule out this possibility as well.
Having ruled out the really obvious stuff, I focused on some of the errant points. Since the snowflakes have symmetry, I changed my test case to be a square which meant the snowflake should be symmetrical about each axis. I then scaled up the number of iterations until I visually observed errors. I was then able to add temporary nodes to the workflow to validate this symmetry and report on records that failed that test. I quickly found several such anomalous records and furthermore it showed that the anomalies themselves were not symmetrical; whatever failure were occurring didn’t happen in the same “place” for each side.
By using the record’s internal row identifiers that Knime generates I was able then to walk backwards in the flow to examine the source records and I quickly realized that the source points in memory were inconsistent. Specifically, just a few records were in the incorrect order which was leading to the wrong line segments being generated using the Lag nodes to copy the prior record’s coordinates.
This was indeed a mystery since the iteration output on disk was correct. It was at this point that I decided to introduce a sequence number for each point so that I could track its progression through the processing for an iteration. And sure enough, the sequence numbers were out of order for those few records that were inconsistent. By adding a Sorter node right before the Lag nodes, I was able to correct the order of the points and my workflow was suddenly working on all of my test cases.
But that still didn’t explain the issue. The critical clue was that it was only happening when I had many generations and/or a polygon with lots of sides. With those cases, the number of points that is generated in any later iteration is significantly larger than the simpler test cases. It was large enough to the point where I hit a tipping point that caused KNIME to either spool these records to disk in between nodes or to parallelize the processing of some of the data inside a node. Either way, when it was recombing the data before the next node it was doing so in a slightly different order. This then affected the Lag nodes being used to generate line segments as they were not copying the expected previous values for a handful of records. In effect, it was an unintended side effect of me trying to be clever and minimize duplicate point information in each row (and to make visualization in a scatter plot easier).
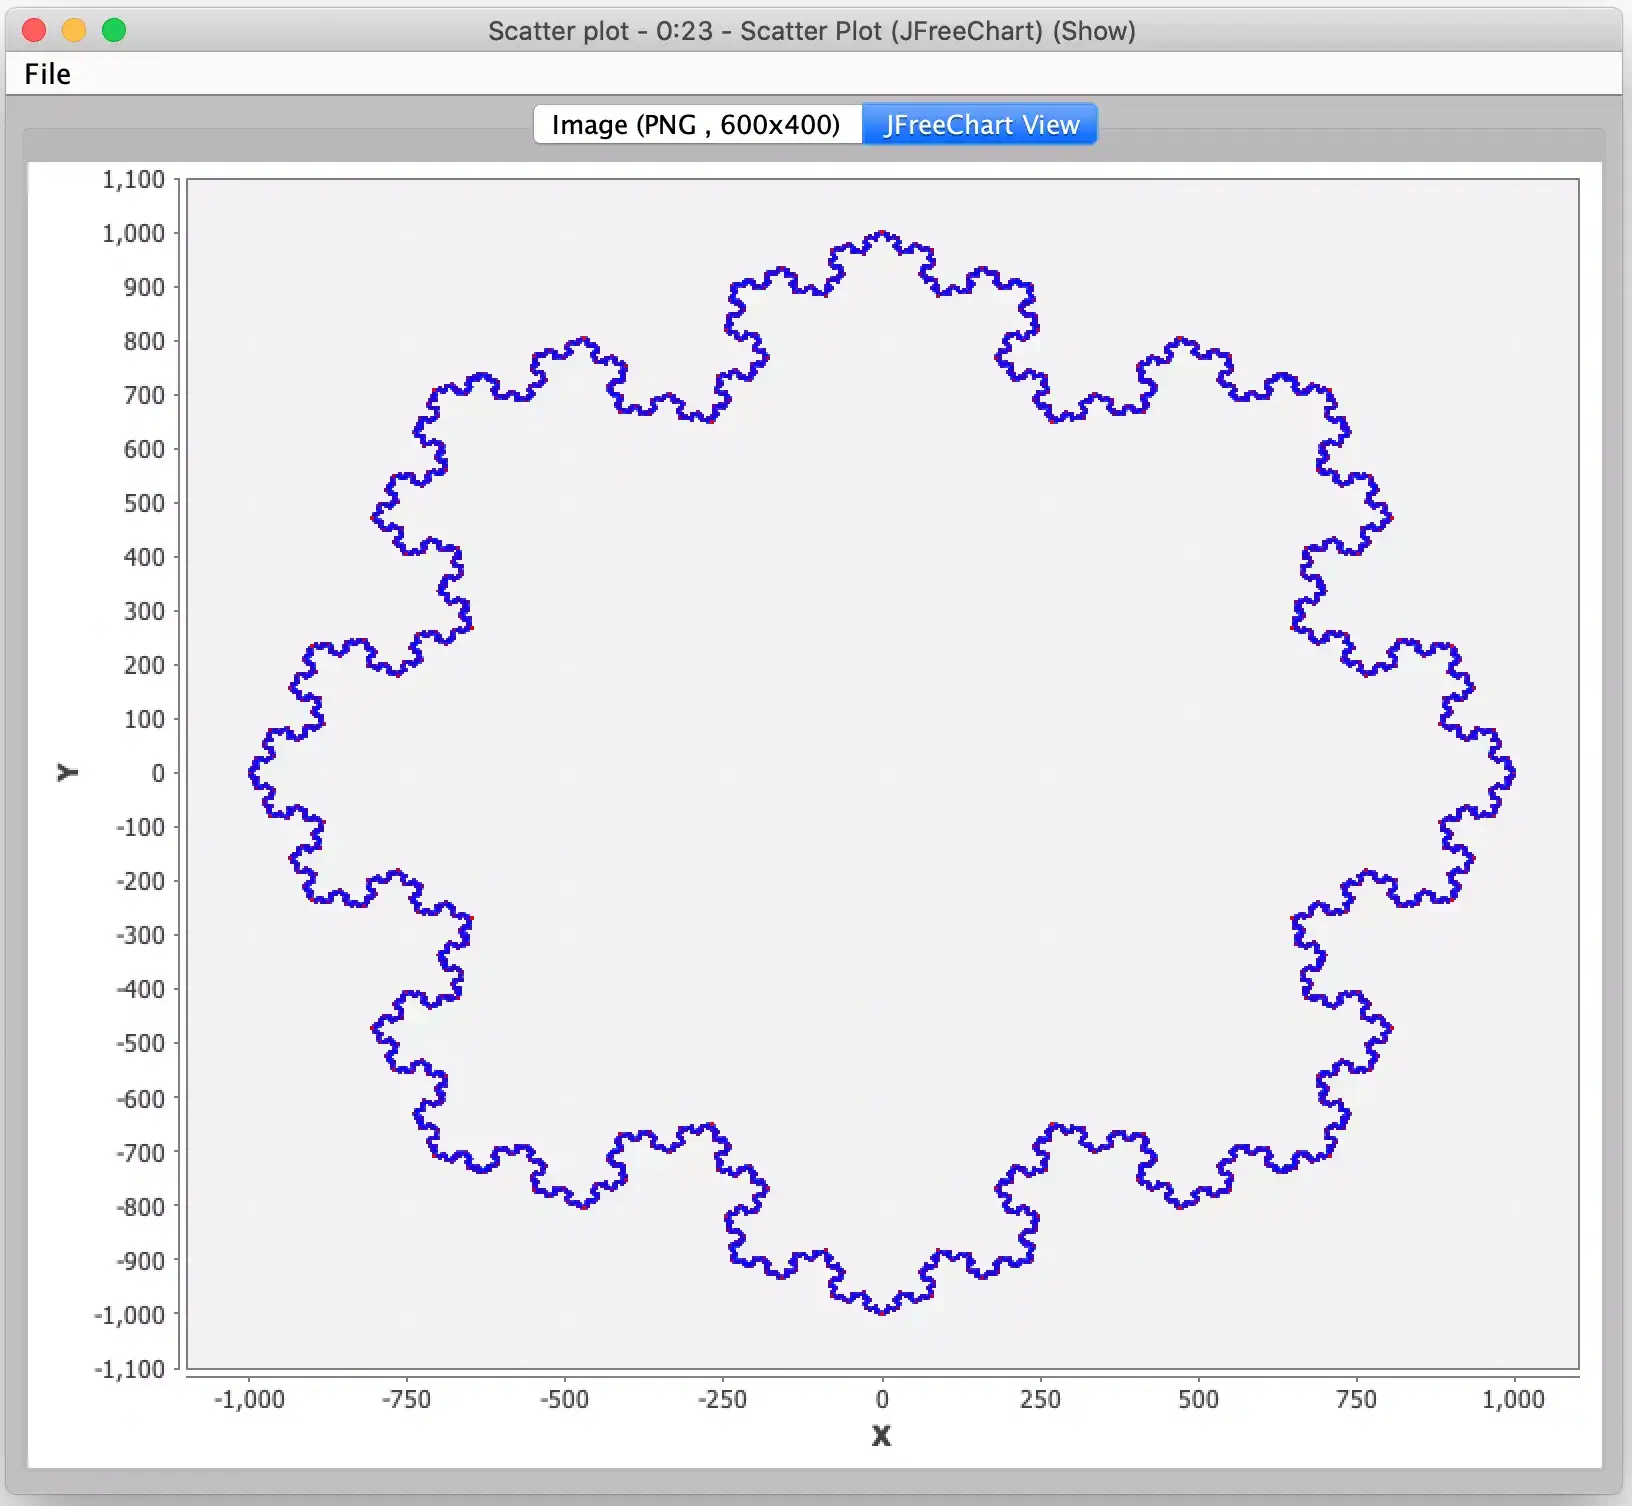
And this is this post’s final lesson for KNIME developers: treat all rows as independent records that may be ordered in an arbitrary fashion. If you require a specific record ordering in a workflow step, enforce that ordering in the step immediately preceding it. Had I been running KNIME in a different environment or with different memory settings, I may not have seen this error at all. Fortunately, it would have been even worse for me had I not seen the subtle error when writing this entry and then had angry readers who did happen to trigger it when trying out my workflow. Now, based on the explicit ordering I built into my final workflow, I am much more confident you can produce monster snowflakes like this:
And now I will challenge you to experiment with this workflow and see what other interesting snowflakes you can get it to produce. A relatively simple change would be to make the snowflake grow outward instead of inward (e.g. a true Koch snowflake). A much harder challenge is to replace the Koch curve math with one of its variants (see the Wikipedia article for some examples). That is an exercise I will leave to the reader but if you do come up with any really cool snowflakes, please send me their picture! And better yet, include the workflow that produced them.
