String Theory: Visualizing Weaving Patterns Using Dynamically Generated Tables in KNIME
My wife has a PhD in Global Public Health and her career has brought me and our two children all over the world. Many years ago, after one of her conferences in Edinburgh, Scotland we all were able to spend some time touring that most wonderful country. One Saturday on that trip, we found ourselves enjoying a Historic Scotland event at Fort William in the Scottish Highlands. There, we were introduced to a simple style of finger weaving. It used a circular cardboard disk and yarn to make friendship bracelets and necklaces with surprisingly intricate patterns. We were all fascinated by how easy it was. For many years after that we would always travel with a ready supply of yarn and cardboard to keep our children entertained.
We would also teach the weaving technique at our local community Maker Faire and hand out kits to anyone interested in trying it. Depending on the age of the person you were teaching, you could often use the weaving lesson as a springboard to talk about the mathematics behind it that made it work. For the weave to work there has to be the right combination of parameters involving prime numbers and modular arithmetic. We would also occasionally try changing the mathematical parameters involved as well as vary the combinations of yarn colors, often with some surprising results.
Fast forward to our recent social distancing for the COVID-19 pandemic: when our family hunkered down in our home, my daughter started sewing masks for friends and family. And my wife began crocheting mask holders to take the strain of the mask elastic off of medical professionals’ ears. With all the yarn getting pulled back out of the craft boxes, I started to experiment with the weavers which led to me tormenting my family with musings about the mathematics. My brilliant wife and children asked me if it would be possible to write software to visualize the weaving patterns. I suspect this is not because they were truly interested but that they knew that if they could get me in my happy place in front of the computer, I’d leave them alone for a few hours, if not days.
Excited by the challenge, I realized that KNIME would be the perfect tool to let me easily generate various weaving patterns and visualize them quickly with a minimal amount of programming. Like my fractal snowflake experiment on my blog, I would not be starting with an existing dataset but would instead be generating the dataset from some initial parameters. In order to support the visualization of many different weaving patterns, I would have to support arbitrary numbers of threads and positions for those threads. And to visualization the results I would need to model the problem in a way that closely matched the physical weaving algorithm.
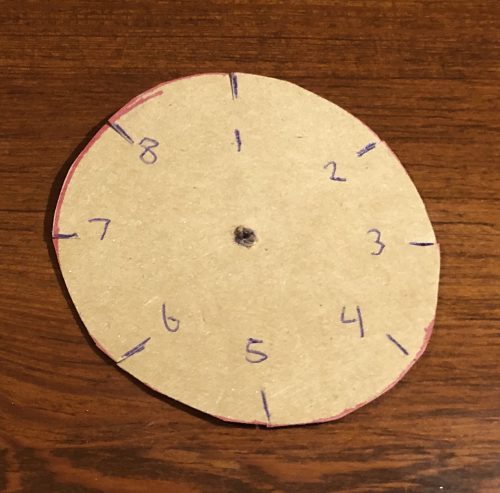
The standard circular weaver is made by cutting a small disk (around 7 centimeters) out of a thin, but sturdy cardboard like a cereal or soda box. Eight notches are then cut around the edge of the disk and a hole is made in the center:
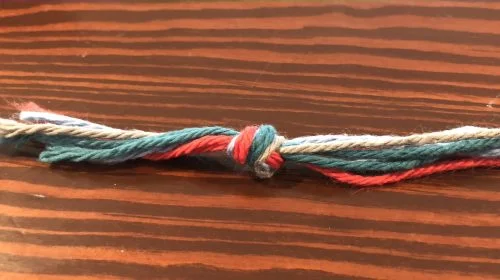
Then gather seven pieces of colored string or yarn, each about 50 centimeters long and tie them all together at one end:
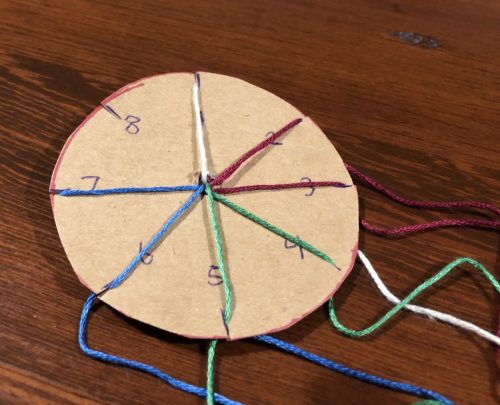
This bundle is then pulled through the hole in the center of the disk so that the knot is on the backside of the disk. Each individual strand is then secured in a slot based on the desired starting order of the colors. In the standard configuration, the seven strands are put in the first seven slots and the eighth slot is left empty:
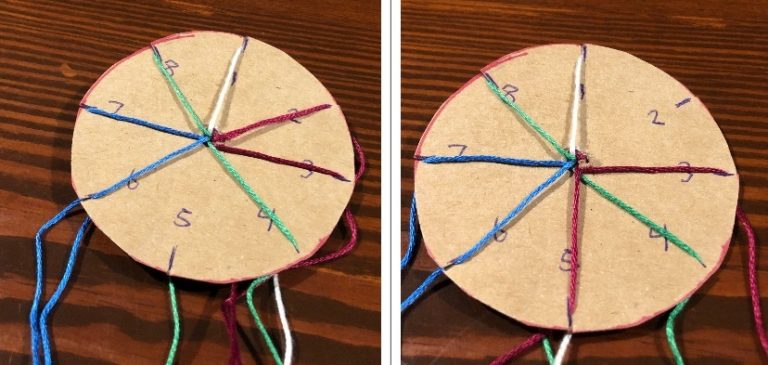
To perform the weaving, start at the empty slot and count downwards to select the third thread before the empty slot. Move that thread to the empty slot and then repeat the process for the new empty slot, wrapping around the numbers as necessary:
As this simple process is repeated, the weave will begin to form in the middle of the disk and should be gently pulled through by tugging on the knot on the backside of the disk. Once the desired length is reached, the strings can be removed from the disk and knotted at the other end, resulting in a single round cord.
When teaching this technique, it is at this point where I usually introduce some of the mathematical concepts going into this weaving. You can ask the participants why there are seven threads for eight slots? And why are you selecting the thread that is three away to fill the empty slot? After all, if you do that three times you end up with the number nine which is one more than the eight slots. You can touch on modular arithmetic and speculate if it is significant that the three and seven are prime but eight and nine are not. And finally, what other combinations might work? Can you have more threads and/or more empty slots? Could you select a different thread to move each turn?
It was these questions that exasperated my family enough that they sent me off to model the weaving in KNIME. Based on the physical weaving process, I could see that the algorithm was simply a matter of moving a numbered thread to a different numbered spot for each iteration. To capture the moves would just require recording which thread is being moved each iteration but this was insufficient for my explorations: I wanted to be able to visualize what the actual pattern would look like so for each iteration I would need to show the position of each thread after one or more threads were moved.
This led me to model each slot as a column in my table (since the slots never change order) and each table row was an iteration in the weave. The contents of each cell would then be the current thread that is in the cell after they were moved from the previous iteration. This meant that my table schema was not fixed; I would need an arbitrary number of columns equal to the number of slots in my virtual weaving disk. I also realized that I did not want to simulate just one weaving configuration at a time. It would be useful if I could try any number of configurations to quickly see which ones might provide interesting results and perhaps eventually find a way to search for the most interesting patterns.
With this initial design idea in mind, I put together a workflow in KNIME to let me visualize any number of weaving configurations made up of arbitrary number of threads, empty slots, and thread selection for each iteration. If you’d like to follow along and experiment with it yourself, it is available at the KNIME hub. I have preconfigured the workflow with four patterns I found interesting and I actually made three of them with real yarn to validate my workflow’s output.
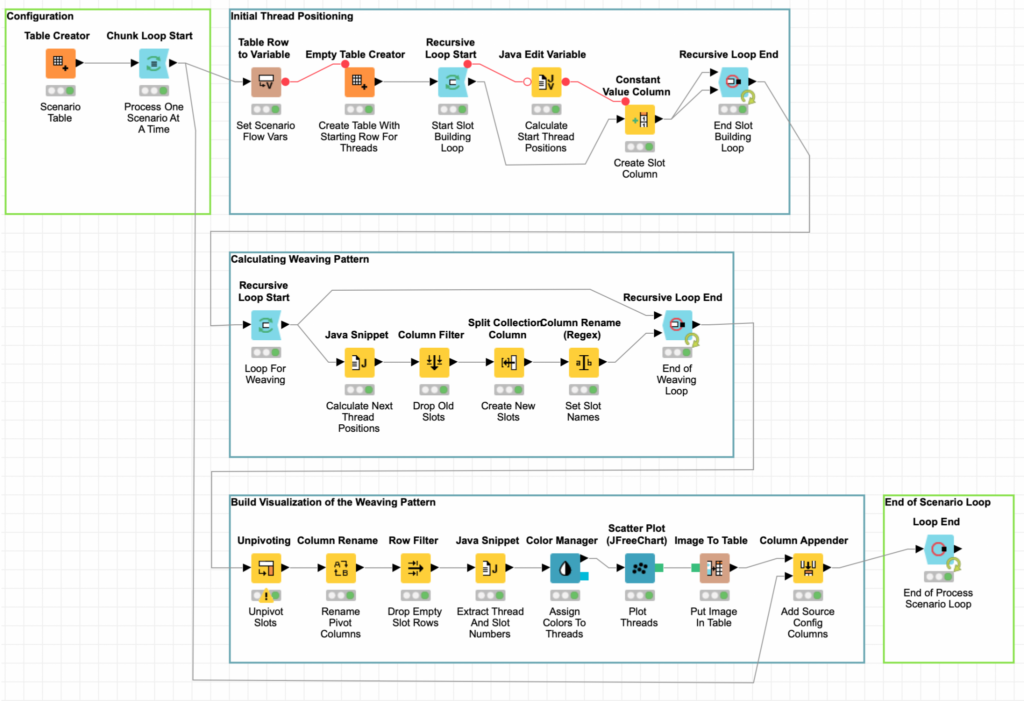
The workflow is relatively straightforward with three main phases: initial setup, weaving, and visualization. The various weaving configurations are set by using a Table Creator which lets me enter a table with predefined values – a constant table if you will.
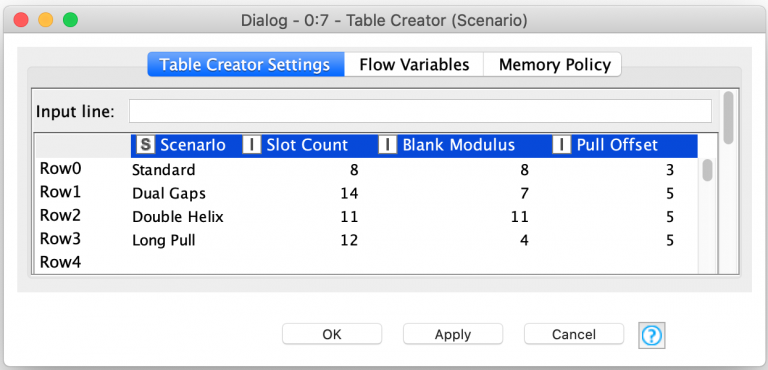
The table configures the following parameters for each weaving scenario being modeled:
| Column | Description |
| Scenario | Name for the weaving scenario |
| Slot Count | Number of disk slots to use for the scenario |
| Blank Modulus | Number indicating what slots to leave empty |
| Pull Offset | How many slots away to get the thread to fill an empty slot |
The weaving scenario configuration table is processed one row at a time using a set of Chunk Loop Nodes and inside the loop each column in the table is immediately turned into flow variables so that they can be used to configure the rest of the workflow. The scenario configuration table is not referenced inside the main processing loop. Instead, each scenario’s loop iteration creates a new table with one row for the initial thread positions. This is done with the Empty Table Creator node configured to generate one empty row without any columns.
In order to create a column for each slot in the weaving scenario, the Recursive Loop Nodes are used to add a single column at a time. Because the recursive loop nodes pass the loop output back to the start of the loop, each loop has the effect of adding another column to the table dynamically. Furthermore, the Recursive Loop End node is configured to only pass the last set of data out of the loop so final result of the loop is a table with one row and a column for each of the configured number of slots.
The columns are created using the Constant Value Column node which supports the setting of each row’s value for the new column. Since we only have one row in the table and we are iterating over each column to create one, we can leverage the loop index to determine the initial thread assigned to each column. These calculations are done in a Java Edit Variable node to set a flow variable representing the selected thread for a column:
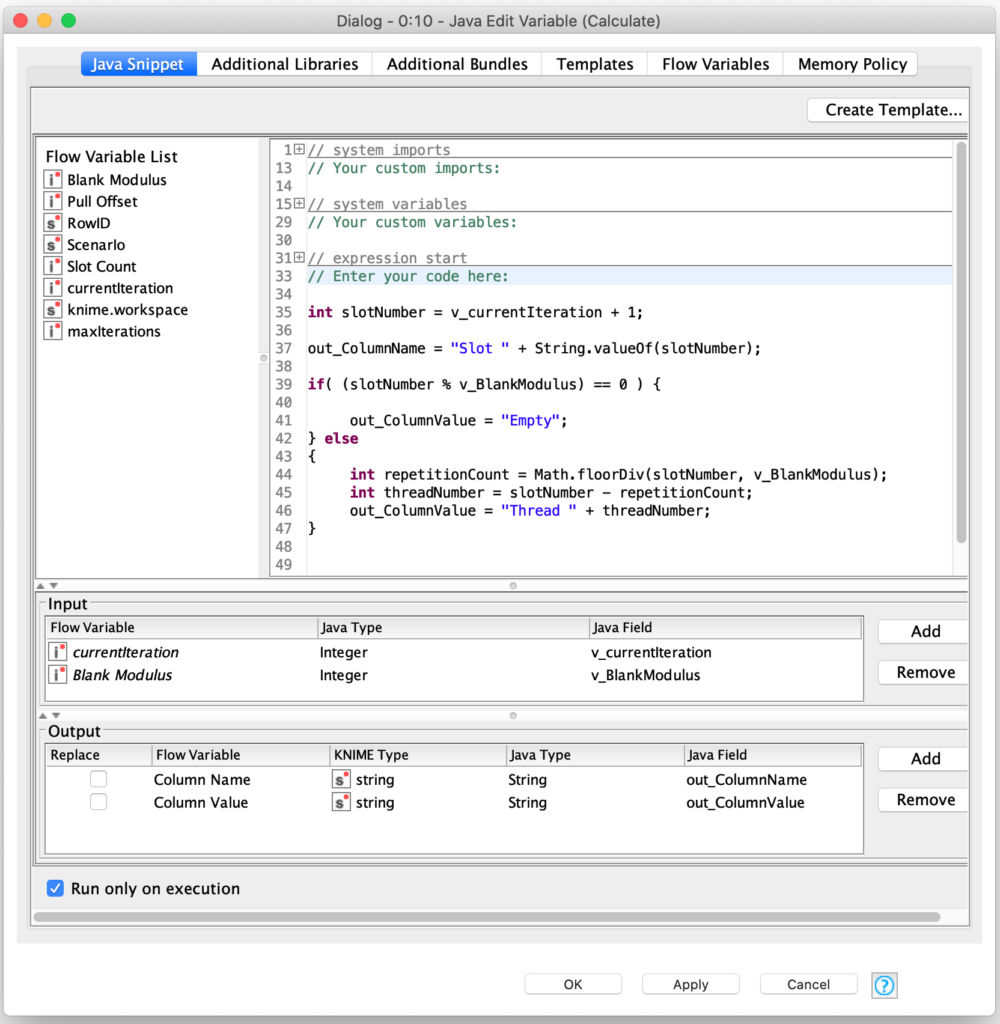
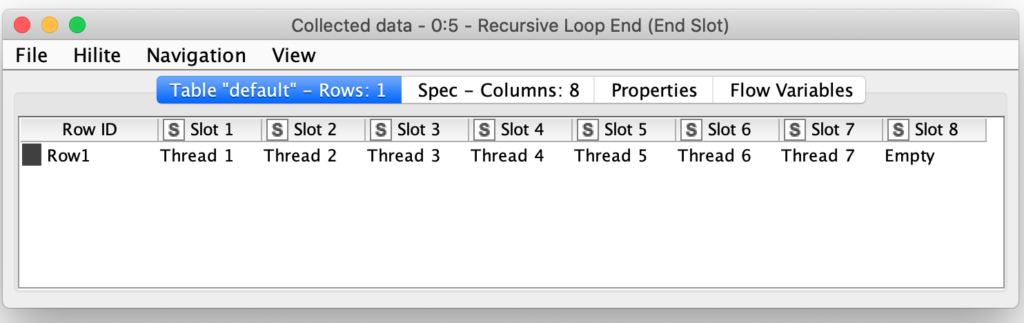
It is here that the Blank Modulus setting for the scenario is used. If the slot number modulo the blank modulus is zero, we know the slot should be left empty. We also count the number of blank slots prior to the current slot so that we can adjust the thread number so that the thread numbers stay consecutive. For example: for the basic weaving configuration, the initial thread state from the position loop is as follows:
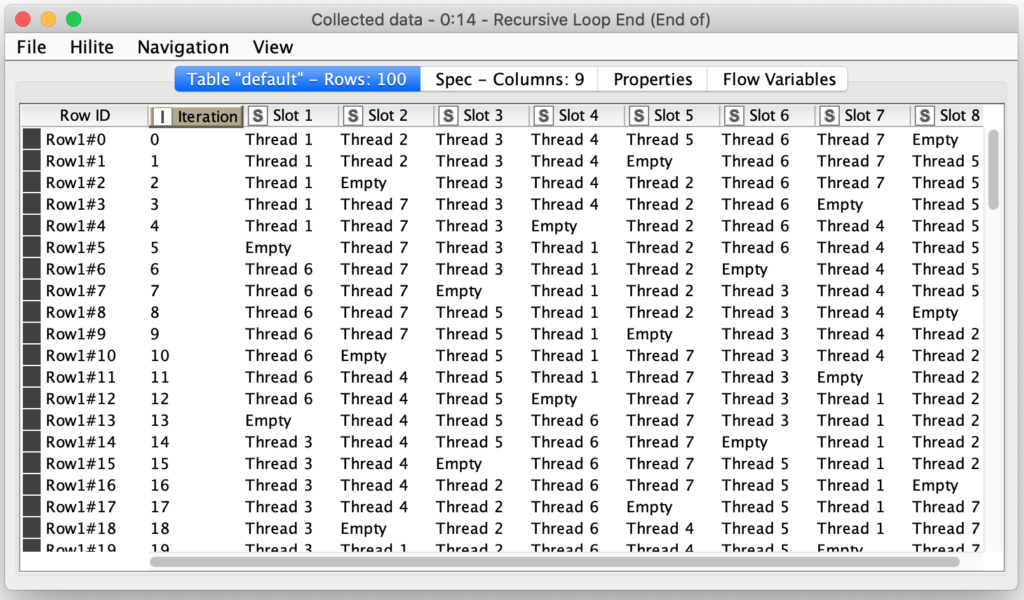
Like the initial thread positioning loop, the weaving simulation loop also uses the Recursive Loop nodes so that each step’s thread positions can be used as input for calculating the next iteration of weaving. But in the case of this loop, each iteration is collected as part of the loop output so that we capture all one hundred iterations of weaving that the loop is configured to produce.
Since the number of slots is configurable, there is no way for the weaving logic to know ahead of time how many columns there will be in the input. I needed a way to dynamically refer to column values. This could be done by pivoting and unpivoting the columns to process them as separate rows but then I would have to deal with lags to determine which thread was being moved into the empty slot(s) for each iteration.
Fortunately, inside the Java Snippet Node, KNIME provides a really awesome function for dynamically referring to columns. The getCell() function can be used to programmatically reference any column in the current row being processed. The weaving logic uses this to select the thread being moved in the blank cells as follows:
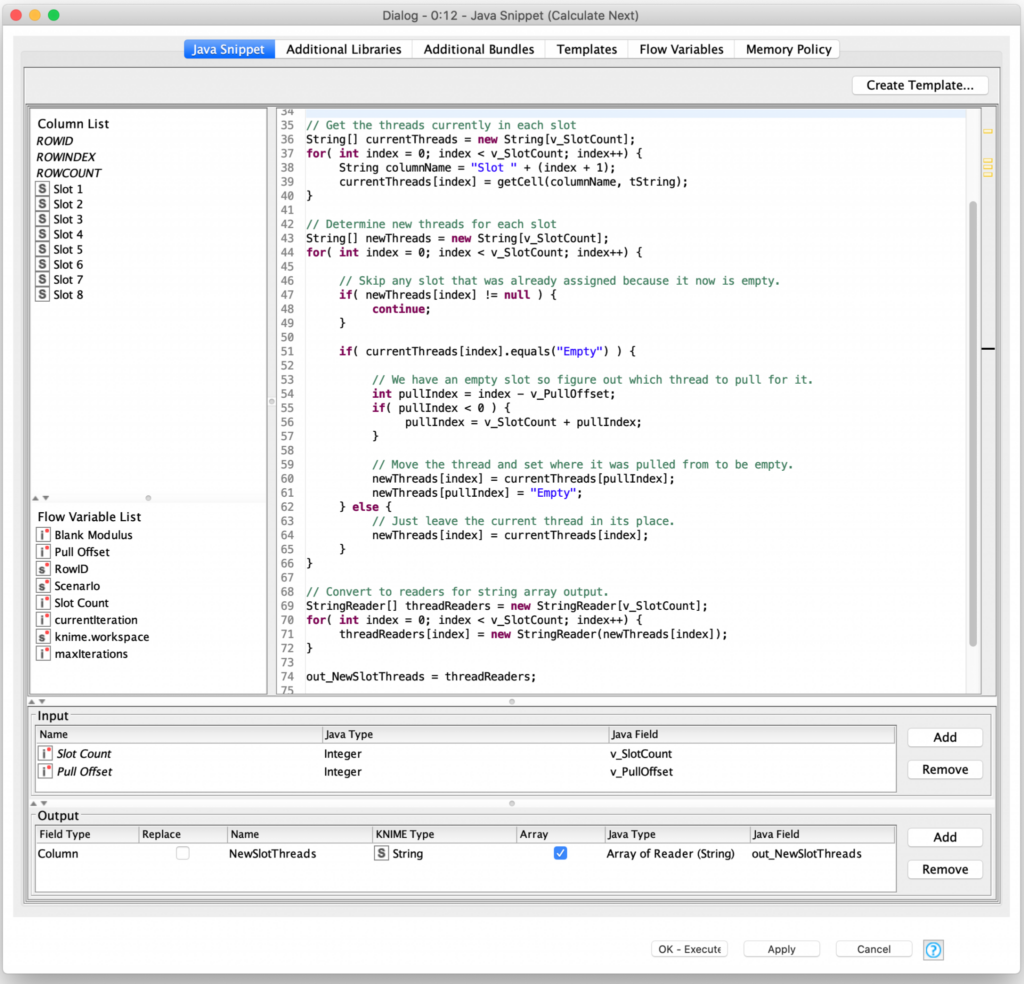
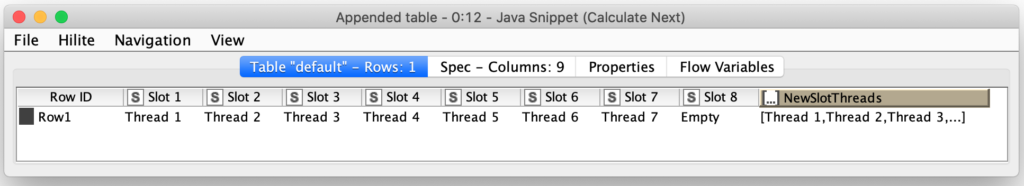
The getCell() function is used in the initial loop in the code block to capture the current thread state into array so that it can easily be processed in the actual weaving loop. That loops creates a second array that represents the new slot assignments for the threads after the weaving iteration. Ideally, there would be an equivalent setCell() function that I could use to update each column with its new thread assignment. Unfortunately, due to the way KNIME’s table configurations are passed internally between nodes this is currently not possible (though there are KNIME forum postings stating that it is under consideration for a future release.) So, to get the new thread state set in the row I elected to save the state to a new column as an array of strings.
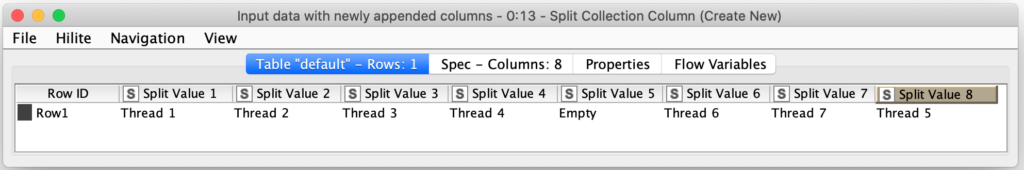
Once the column with the new state has been produced, we can immediately drop the old slot columns which still contain the previous iteration’s thread positioning so that we can extract the new thread position from the new state column’s array of strings. And, of course KNIME has a node that makes this easy: the Split Collection Column node which separates an array of values into a column per value:
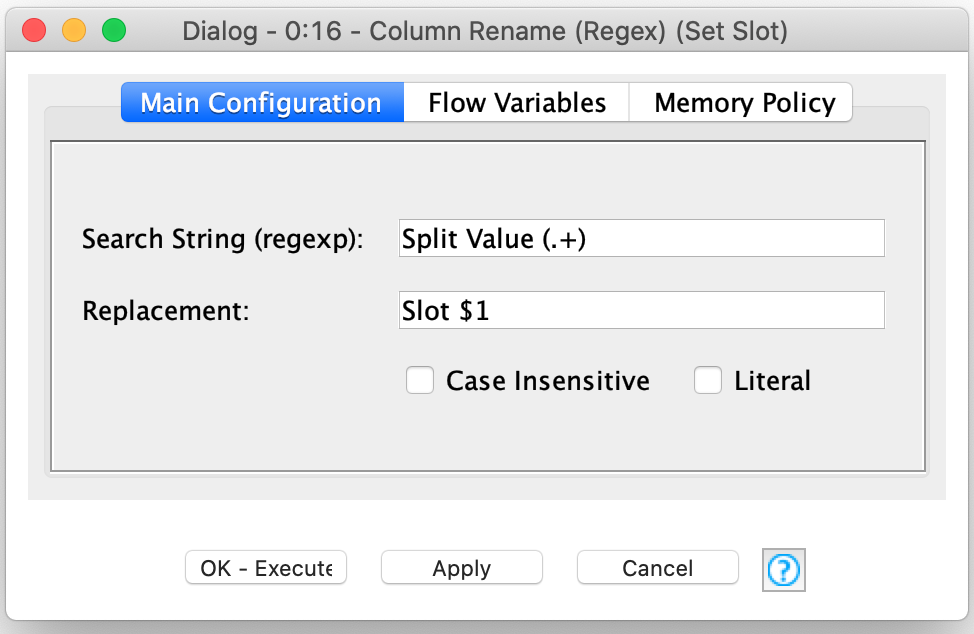
The Split Collection Column node will generate an arbitrary number of nodes depending on the length of the longest collection being split. Fortunately, the Column Rename (Regex) node can rename all of the columns at once using regex groups to extract the slot number for use in the new name for each column.
With the freshly renamed columns, we now have a single row table whose schema is the same as it was for the start of the loop but with new thread assignments for each slot’s column. The Recursive Loop End node then sends the new row both to the output and back to the start of the loop for calculating the next iteration of the weaving. This repeats for a one hundred iterations (set by the node configuration) which produces enough data to visualize the weave patterns of scenarios with up to 30 or so threads. If you want to try weavings involving even more threads, you can simple update the recursive loop end’s configuration to perform more iterations.
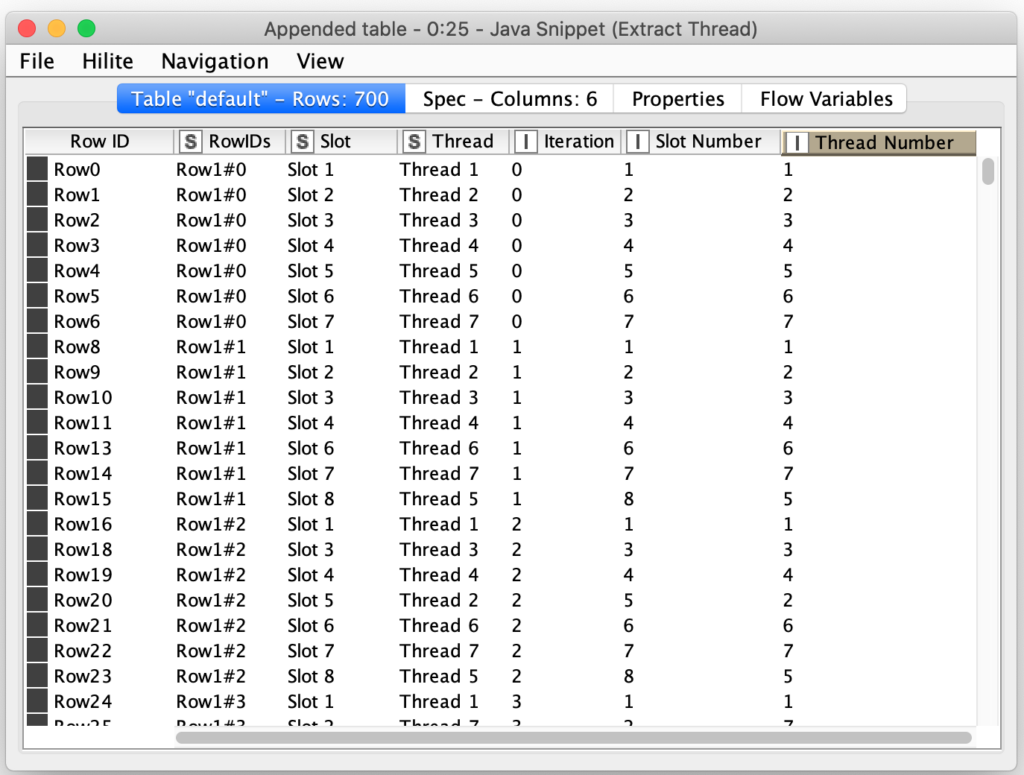
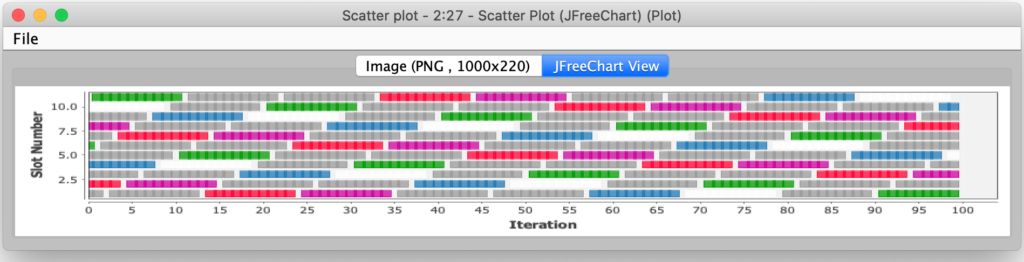
The final block of the workflow builds the visualization of the weaving pattern. For the visualization I elected to use a scatter plot which let me effectively assigned a color to each slot in the weaving output based on the currently assigned thread. To do this, I unpivot each row so and extract the column number and its assigned thread number. This effectively gives me a set of coordinates and color numbers for each position in the weaving:
The coloring of each plot point is done with a Color Manager node which assigns a color to each nominal value in the Thread column:
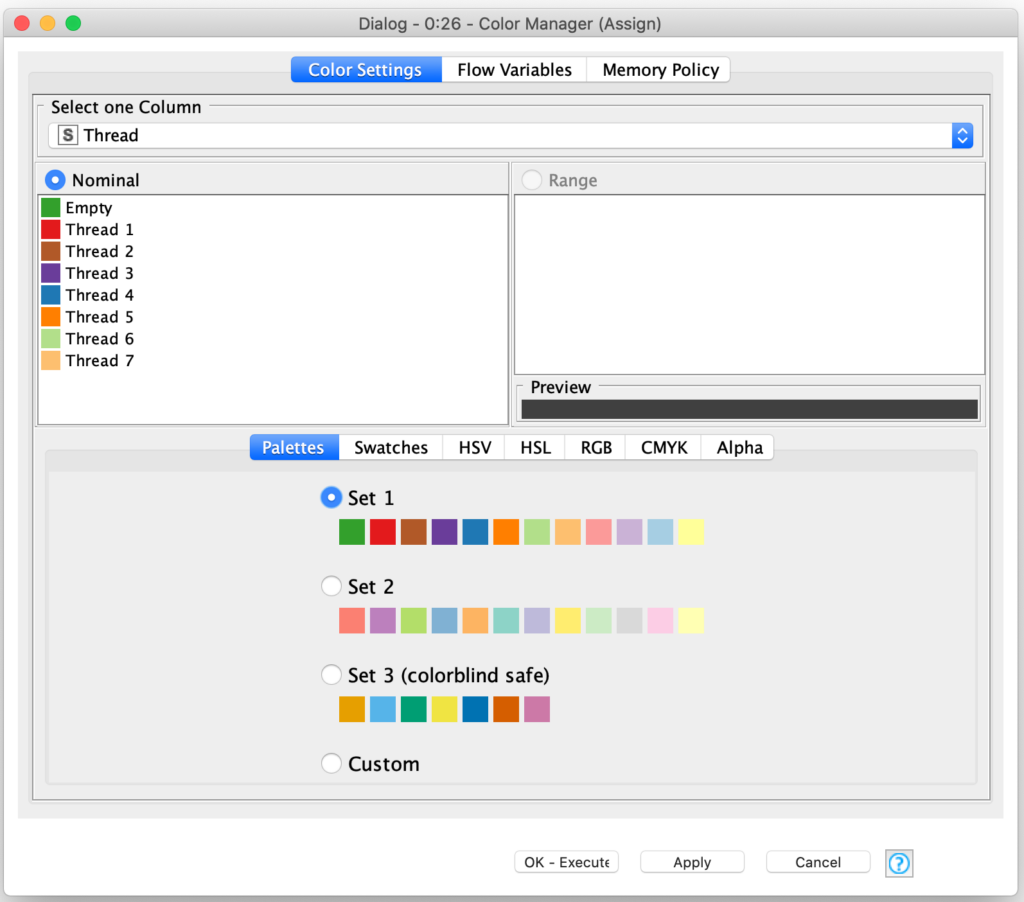
There is one caveat with this approach: the color manager saves its state for its current input so that you can override its settings with custom colors. Since each scenario we are processing has potentially a different number of threads, the Color Manager will fail if it sees a nominal value that it was not configured with (e.g. a thread number it hadn’t seen before). This issue can be avoided by selecting one of the preconfigured sets in the Color Manager node.
Once colors are assigned, the Scatter Plot node is used to render the visualization of the weaving pattern and the pattern is then joined back with the configuration columns from the scenario table before being saved for the final output by the scenario loop end node. The final output is a table of all weaving scenarios that were processed:
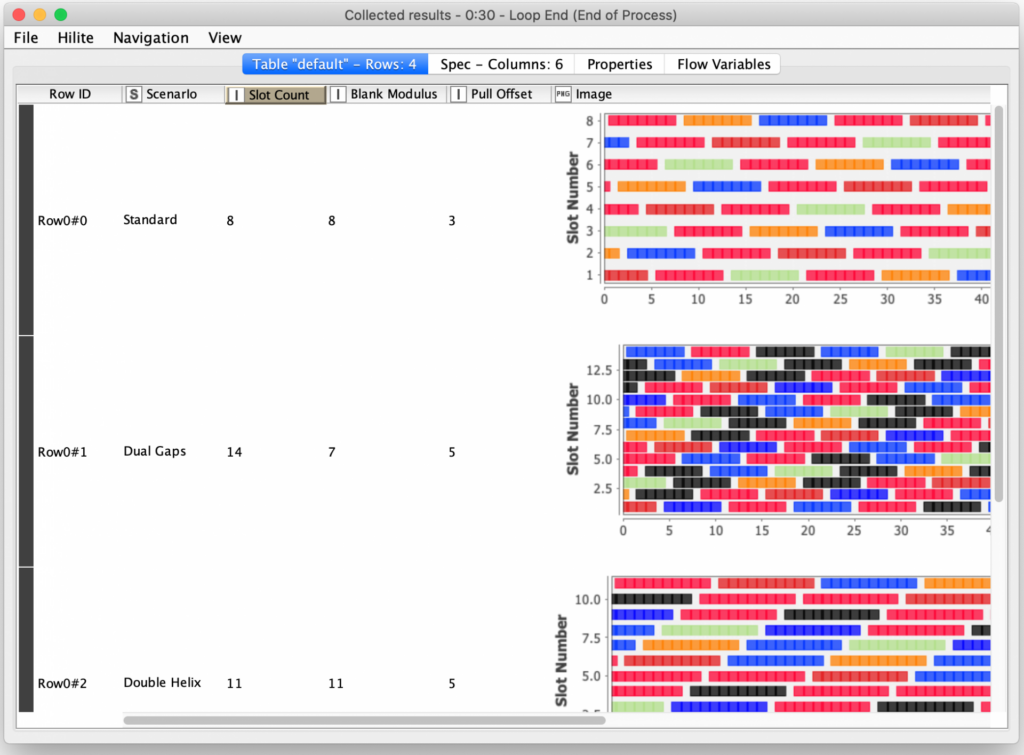
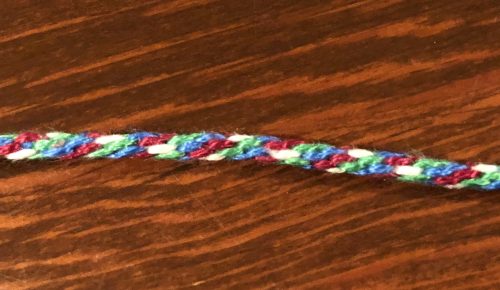
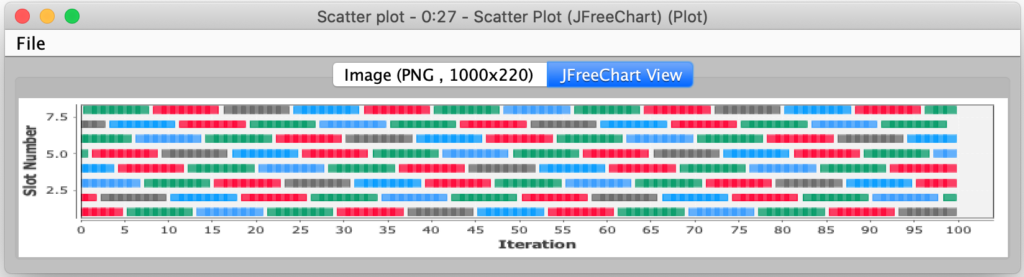
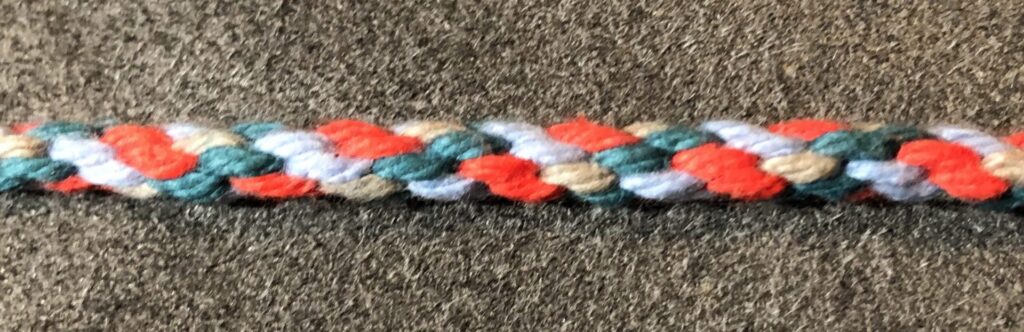
As I previously mentioned, I validated the workflows output by actually making some of its patterns using yarn. The colors are not the best – I had to make do with what we had on hand since I just couldn’t duck out to the craft supply store. Following are the results for the first three scenarios: for each of them I manually tweaked the Color Manager node’s color mappings to match my physical yarn colors and produced the visualization for the pattern. Each synthesized pattern is followed by a picture of the actual physical weaving result.
Standard scenario:
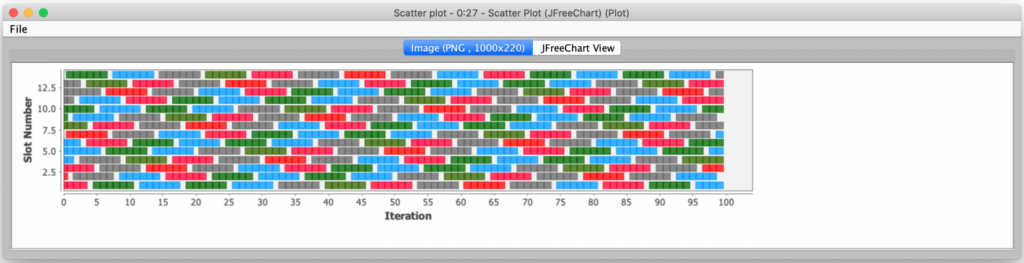
Dual Gaps scenario:
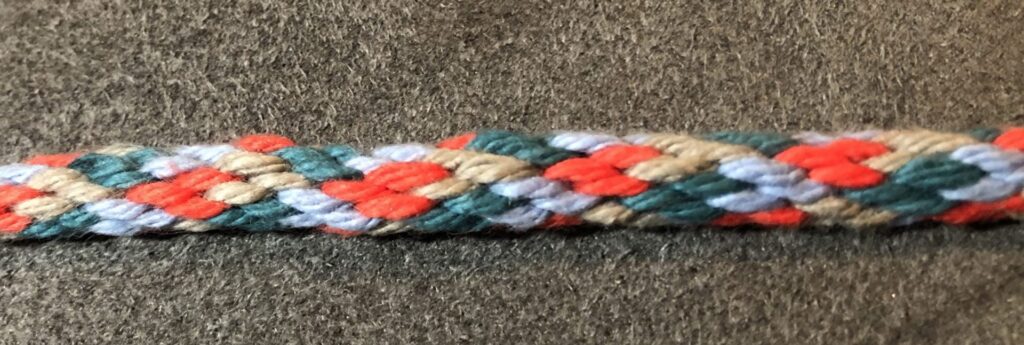
Double Helix scenario:
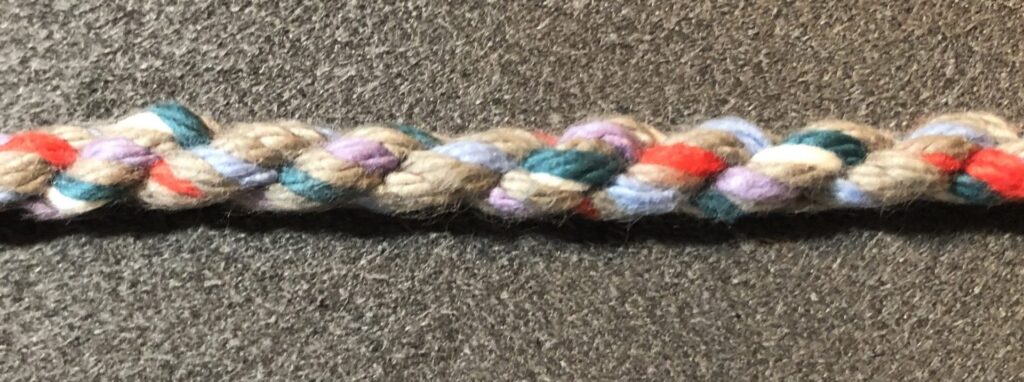
In each of these cases, the generated visualization captured the relative positioning of each color. But in the more complex Double Helix scenario, the modeling did not capture the interesting physical structure that resulted from having a larger pull offset. In fact, I found that occasionally some of my trial configurations failed to produce a valid weaving of all threads. If they did not, they usually degenerated into multiple separate sets of woven threads that did not connect with each other.
That degenerate behavior can be explained by the interaction of the blank modulus, total slot parameters, and pull offset. If you look at the output of the selected threads, you will see sets of independent cyclical groups. This indicates that my weaving simulation could be enhanced to detect these conditions to help discover only valid patterns. Furthermore, I am intrigued by the idea of using pattern detection to determine the number of iterations it takes for a pattern to repeat.
Perhaps this is something I’ll revisit in a future blog posting. For now, I hope this posting has shown you a novel way to leverage the extremely accessible power of KNIME, particularly when it comes to its dynamic table capabilities. This application barely scratched the surface: it is possible to leverage these capabilities for dynamic self-service style processing using auto-type detection, statistics, and machine learning. There are good examples of these capabilities in the KNIME hub.
Finally, please let me know if you find any really intriguing weaving scenarios and I’ll assign bonus points if you actually weave them. But if they’re intriguing enough, I might be willing to try them too. After all, it’s not like I have anywhere else to go right now and my wife and I can only play so much Farkle…
