Using Your Knowledge Graph Database for Analytics
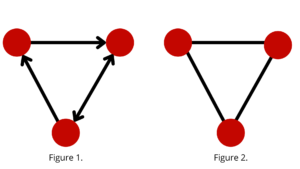
Here is a very quick primer for those who are new to graph databases. Graph databases are based upon graph theory, which studies the relationships (edges) between two or more objects (nodes) in a dataset. The edges may be directional, showing the flow of the action from one node to the other (see Figure 1). An example of a directional flow can be seen in the use of materials in the manufacturing of parts. However, edges can also be undirected, showing the equality of action (see Figure 2). An example of an undirected flow can be seen between friends on Facebook. Who established the friendship is not essential once the link between the friends has been set.
You have built a knowledge graph database to capture and store the interdependencies of your data. Your database is based on a data model that encapsulates the complexity of the interconnectedness between the data points. Therefore, you can display these relationships in an easily consumable format for both humans and machines. Now that you have captured the robustness and correlation of the data, it is time to leverage that information to meet the mission objective of the organization.
We start with the simple graph queries that will return answers that you may already know or can easily quantify. For example, “How many relationships does X have?” or “How many connections are within three hops of X?” These queries are much easier and faster to run in a graph database because the relationships are the critical part of the questions. We could use the data dictionary to answer the former question in a relational database, but you would have to create a recursive query to answer the latter. Both of these are sub-optimal queries compared with the graph database query. In the first query, you will need to join the data dictionary table containing the relationships with the table you are interrogating so that you can use the attributes to qualify the query further. A graph query exposes the node properties (attributes) to reduce the number of records counted in the result set.
Graph algorithms are the next level of query in a graph database. These queries have their basis in network science and allow a person to perform more hypothesis-seeking of the data, one where you may know the general pattern but not the exact answer. The earliest example of this graph theory challenge is the 1736 Seven Bridges of Königsberg problem.
Because we live in an interconnected world, we not only need to understand the entity itself, but we need to try to make meaning from and understand relationships between entities. Let’s take a look at some real-world examples we may take for granted today:
- Have you ever purchased something from Amazon and then been prompted to buy a seemingly unrelated item? This prompt is Item-to-Item Collaborative Filtering of a Knowledge Graph.
- Have you ever found a friend of a friend you lost contact with years ago via LinkedIn or Facebook? These Friend of Friend relationships are stored in graph databases and are used to understand and predict preferences or behavior.
- After making a credit card purchase, have you ever received an alert verifying you made the transaction? This fraud detection and prevention alerting is done using graph database technology to detect fraud and money laundering activities.
The place where graph databases and graph algorithms shine the brightest is in big data. These large datasets are teeming with connections that are not easily seen. Because of the ability of graph technologies, we can visualize the relationships which are naturally found in these datasets. We need not “wrangle and strangle” the data into a formalized data structure that an individual has devised because that is what works for a particular application. Instead, we can now use the data in a more natural and raw format, providing insights via the relationships we never thought to ask.
Let’s investigate the three examples above in more detail to see the power of the graph.
As used by Amazon, item-to-item collaborative filtering is the ability to conflate the information they know about you (age, gender, location, etc.) with your previous purchases and with the items in your current shopping cart to create a purchase profile. This profile is matched against other purchase profiles equivalent to yours to see what items you haven’t purchased that other individuals with the same or similar profile have purchased in the recent past. This matching is done in real-time, thereby always providing the customer with the most up-to-date options. For example, items that are sold out or something that may have sold last week or last month may not be appropriate for this purchase (i.e., seasonal or holiday items). This moderately complex query can be run on a graph database in sub-seconds. You can try this with a relational database, but the performance will not come close to the speed of the graph database.
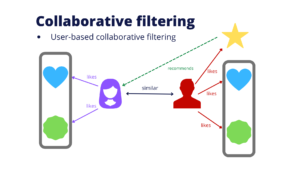
Figure 3
Friend of friend relationships are good to know on LinkedIn or Facebook, but this technology also has other real-world uses like contact tracing. For example, we have seen the use of graph analytics and graph data science to help the CDC track and predict the spread of the COVID19 virus and various variants across the world. Because graph databases can rapidly ingest the data and establish the relationships between the attributes, researchers were able to analyze the data quickly. As a result, they identified high-risk individuals and the relationships between the individuals and prescribed medications and treatments that helped many patients recover from this deadly virus.
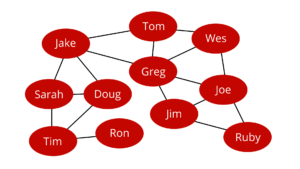
Figure 4
Finally, fraud, waste, and abuse is another place where the graph database excels because of the data model’s flexibility and query response speed. Let’s use credit card fraud for this example. Your credit card was skimmed from a local gas station terminal and sold on the dark web. You have no idea that this has occurred and continue to use your card, as usual, making a purchase or two per week in the same locations near your home. Suddenly, there is an online purchase from a store you have never used before, and the IP address for the purchase is not your usual IP address but rather one that is located several hundred miles from your home. You had made a “normal” purchase from a local retailer just a few minutes earlier. Because the time and location of the second purchase are outside the bounds of physical transportation, this should set off a fraud flag and decline the purchase. Many companies will then alert you (the customer) of the potential fraud via text, asking if you are trying to make the purchase. If you agree that you are making the purchase, the transaction will go through when reprocessed; otherwise, the credit card company will close your account and issue a new card.
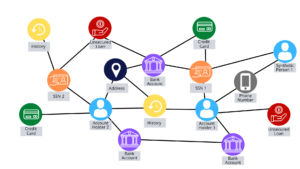
Figure 5
As you can see, graph databases and graph algorithms have become mainstream and provide the flexibility and speed needed to meet the challenge of today’s deluge of interconnected data. I recommend learning more about the power of graph technologies and adding these tools to your arsenal of data solutions.
About the Author
Jim McHugh is the Vice President of National Intelligence Service – Emerging Markets Portfolio. Jim is responsible for the delivery of Analytics and Data Management to the Intelligence Community.
