Solution for Distributed Tracing with Spring Boot and ELK
As we discussed in a previous blog post, the key characteristic of a microservice is a distributed system. As you design the microservice system, there are several challenges you need to overcome when you develop the system. Today, we will discuss one of the challenges – log data management.
Design Challenge
In a microservice architecture, the system will consist of multiple services running in parallel. In practical terms, this means that each will generate log files. Unfortunately, it’s hard and time-consuming to visit and review the individual log files for troubleshooting and understand precisely what happened. In addition to that, you need to identify a series of service calls made between microservices and tie them back to the initial HTTP request made by a client. Anyone who has tried to employ log data will have found that, if you manually comb through the log data spread, the sequence of the executions distributed among the microservices would be extraordinarily inefficient and painful.
Solution
We can employ two design patterns for this problem – Log Aggregation and Log Correlation. Log Aggregation is used to continuously log the service activities and store the logs into a single repository – supported by a search capability. Log Correlation – which can be called Distributed Tracing – helps to assign the initial service request, which is called by the external client. These service requests use a unique ID and pass the request along to the next service.
Log Correlation Implementation
Suppose you want to implement Log Correlation manually. In that case, you will need to decide where the unique ID – also called a correlation ID – is generated – and assign it to the incoming requests. The best place for that is the API gateway – which we will cover in more detail in a future blog. But, first, we need to be aware that all incoming requests must feed through the API gateway since the API gateway acts as the front door for the microservice system. As the requests enter, they are intercepted by the log correlation filter and assigned with the correlation ID.
It is certainly possible to develop an HTTP filter in the getaway for the log correlation, but I would like to show how you can leverage Spring Cloud Sleuth in this paper. As shown in Figure 1, the Sleuth library needs to be added to the pom.xml in each service. It will download all libraries required by the Spring Cloud Sleuth. That’s all you need to do for the Sleuth.

Figure 1: Dependency for Sleuth added in pom.xml

Figure 2: HelloWorld service that calls GoodNight service

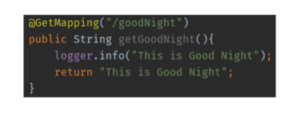
Figure 3: GoodNight service

Figure 4: Service Name, Trace ID, and Span ID are inserted by Sleuth as the logger prints out
For the implementation example, I prepared two services, HelloWorld and GoodNight, as shown in Figures 2 and 3. The Sleuth will inject the correlation ID and the span ID in every log when the services are called, as shown in Figure 4. The correlation ID will be the same as propagated to the next services, but the span ID will be different for each service call. You have the logical information to group the related log data, but you still have the logs spread over multiple files. Let’s discuss how we can implement log aggregation to collect all logs in one place.
Log Aggregation Implementation
To aggregate the logs, you will need to build a centralized logging architecture. There are multiple options available, but we will review the ELK (Elasticsearch, Logstash, Kibana) stack in this blog.
Below is the high-level description of each tool responsibility.
- Logstash: Responsible to ingest the log data to Elasticsearch
- Elasticsearch: Responsible to index the ingested data
- Kibana: Responsible to retrieve the data from Elasticsearch

Figure 5: Flow of Log Aggregation using ELK Stack
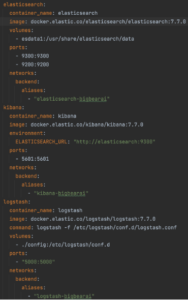
You can run the ELK stack by downloading from the elastic website or leveraging Docker with the docker-compose configuration similar to Figure 6.

Figure 6: Docker Compose configuration to run ELK Stack containerized
Regardless of how you run the ELK stack, there are two key steps you need to ensure to make the log aggregation work correctly.
- Set up a log appender in the service: This will determine where the logs will be sent to, such as files, tcp, stdin, etc. In my example, I used them to be written to files.
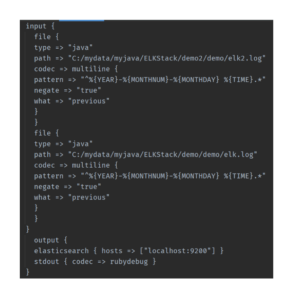
- Define the input and output of Logstash: You need to configure Logstash for input and output in the config file. The input should be matched with the log appender, and the output should be for the Elasticsearch. The Logstash configuration file will be something like Figure 7.

Figure 7: Example of Logstash Configuration File
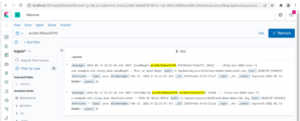
When the log aggregation works with the ELK stack correctly, you will be able to query the logs with the same correlation ID as shown in Figure 8.

Figure 8: Logs searched by Trace ID in Kibana
Conclusion
We discussed why distributed tracing is needed for the microservice and how Spring Boot and the ELK stack can be implemented as the solution for that. Even though the log correlation can be implemented manually, you will save time and effort by employing Spring Cloud Sleuth. The ELK stack can be the perfect open-source solution for log aggregation.


